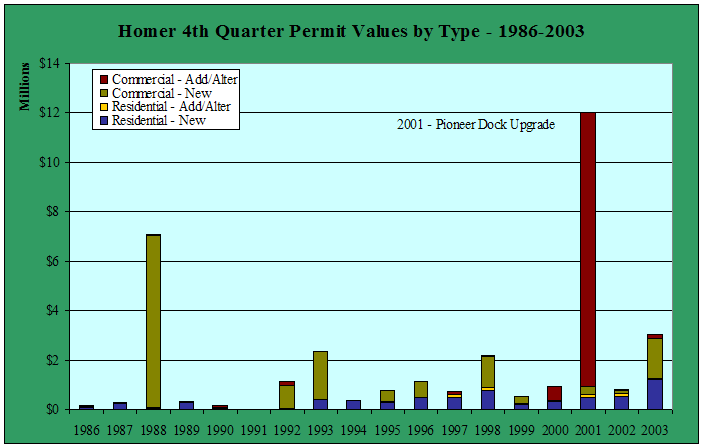
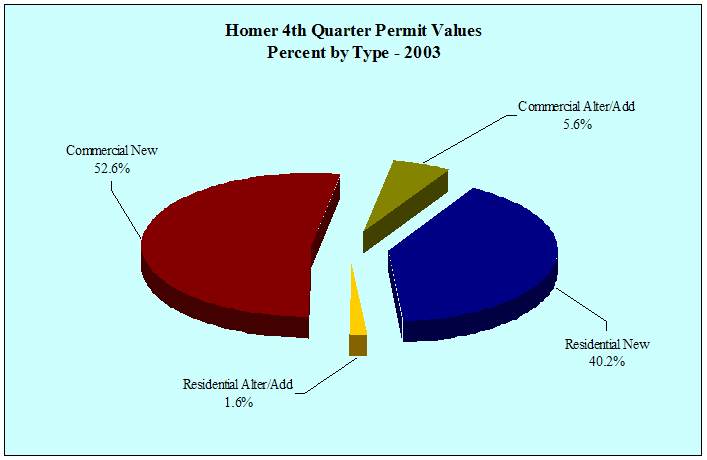
| Homer
4th Quarter Permit Values by Type - 1997-2003 - in $ |
| |
1997 |
1998 |
1999 |
2000 |
2001 |
2002 |
2003 |
Annual
Change |
| Residential
New |
480,000 |
761,750 |
195,000 |
326,000 |
492,300 |
560,200 |
1,222,900 |
118.3% |
| Residential
Alter/Add |
150,000 |
145,000 |
50,000 |
0 |
120,000 |
104,320 |
50,000 |
-52.1% |
| Commercial
New |
0 |
1,259,000 |
316,000 |
48,000 |
300,000 |
78,000 |
1,600,000 |
1951.3% |
| Commercial
Alter/Add |
100,000 |
40,000 |
0 |
543,982 |
11,100,000 |
72,000 |
170,000 |
136.1% |
| Total |
730,000 |
2,205,750 |
561,000 |
917,982 |
12,012,300 |
814,520 |
3,042,900 |
273.6% |
| Annual
Change |
|
202.2% |
-74.6% |
63.6% |
1208.6% |
-93.2% |
273.6% |
|
|


