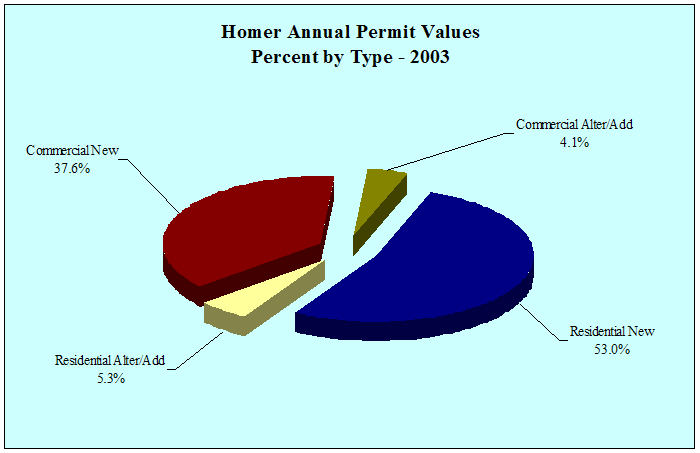
| Homer
Annual Permit Values by Type - 1997-2003 - in $ |
| |
1997 |
1998 |
1999 |
2000 |
2001 |
2002 |
2003 |
Annual
Change |
| Residential
New |
3,236,400 |
2,850,750 |
3,646,000 |
2,611,040 |
4,047,780 |
4,226,720 |
8,120,455 |
92.1% |
| Residential
Alter/Add |
518,865 |
539,600 |
367,000 |
230,060 |
609,160 |
536,620 |
806,600 |
50.3% |
| Commercial
New |
3,630,000 |
2,528,025 |
6,906,000 |
1,663,480 |
2,410,800 |
4,990,740 |
5,764,520 |
15.5% |
| Commercial
Alter/Add |
304,000 |
281,500 |
21,000 |
2,624,392 |
12,732,950 |
294,699 |
635,240 |
115.6% |
| Total |
7,689,265 |
6,199,875 |
10,940,000 |
7,128,972 |
19,800,690 |
10,048,779 |
15,326,815 |
52.5% |
| Annual
Change |
|
-19.4% |
76.5% |
-34.8% |
177.7% |
-49.3% |
52.5% |
|
|


