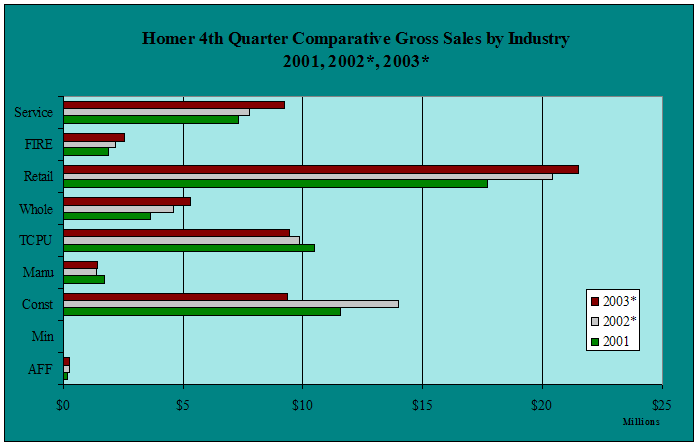
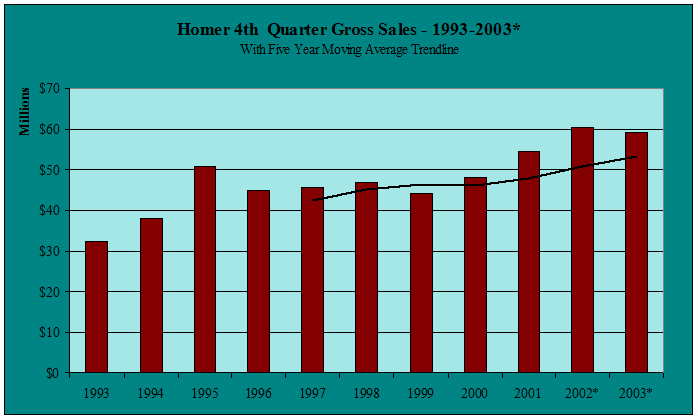
| Homer
4th Quarter Gross Sales by Industry - 1997-2003 - in $ |
| |
1997 |
1998 |
1999 |
2000 |
2001 |
2002* |
2003* |
Annual
Change |
| AFF |
188,082 |
285,512 |
469,897 |
356,399 |
180,478 |
269,340 |
269,986 |
0.2% |
| Min |
141 |
130 |
0 |
1,117 |
629 |
0 |
488 |
NA
|
| Const |
9,251,612 |
8,120,674 |
8,424,403 |
10,008,082 |
11,585,650 |
13,986,726 |
9,366,407 |
-33.0% |
| Manu |
4,161,874 |
4,924,181 |
1,970,485 |
1,559,906 |
1,734,909 |
1,392,884 |
1,444,109 |
3.7% |
| TCPU |
7,636,131 |
8,323,199 |
8,039,318 |
8,228,869 |
10,477,076 |
9,846,186 |
9,442,019 |
-4.1% |
| Whole |
2,942,858 |
3,311,316 |
3,277,873 |
3,765,653 |
3,645,705 |
4,601,989 |
5,295,755 |
15.1% |
| Retail |
14,140,057 |
14,700,690 |
15,006,104 |
16,380,328 |
17,737,849 |
20,394,348 |
21,502,027 |
5.4% |
| FIRE |
1,635,462 |
1,916,911 |
1,647,073 |
1,585,348 |
1,874,856 |
2,177,404 |
2,541,345 |
16.7% |
| Service |
5,754,151 |
5,217,004 |
5,229,365 |
6,337,455 |
7,299,830 |
7,751,691 |
9,254,190 |
19.4% |
| Total |
45,710,368 |
46,799,617 |
44,064,518 |
48,223,157 |
54,536,982 |
60,420,568 |
59,116,326 |
-2.2% |
| Annual
Change |
|
2.4% |
-5.8% |
9.4% |
13.1% |
10.8% |
-2.2% |
|
|


