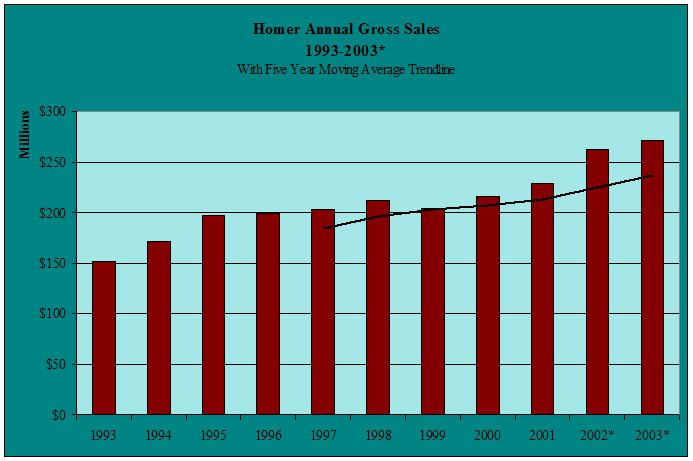
| Homer
Annual Gross Sales by Industry - 1997-2003 - in $ |
| |
1997 |
1998 |
1999 |
2000 |
2001 |
2002* |
2003* |
Annual
Change |
| AFF |
771,781 |
1,231,758 |
1,132,289 |
1,763,891 |
931,926 |
1,013,352 |
1,425,177 |
40.6% |
| Min |
740 |
130 |
13,595 |
24,864 |
15,819 |
8,582 |
936 |
-89.1% |
| Const |
29,257,764 |
37,787,332 |
27,642,104 |
42,378,954 |
40,149,696 |
45,827,738 |
41,380,613 |
-9.7% |
| Manu |
19,780,094 |
19,649,701 |
16,450,883 |
6,761,789 |
6,482,895 |
6,590,594 |
6,680,960 |
1.4% |
| TCPU |
31,416,297 |
34,491,856 |
33,675,536 |
34,493,682 |
40,495,596 |
42,137,752 |
40,012,090 |
-5.0% |
| Whole |
17,366,525 |
14,672,913 |
17,513,809 |
16,999,389 |
18,602,483 |
19,915,750 |
22,062,603 |
10.8% |
| Retail |
64,382,878 |
64,712,270 |
66,221,369 |
71,465,479 |
75,782,152 |
87,816,135 |
97,225,467 |
10.7% |
| FIRE |
9,273,104 |
8,574,588 |
7,448,936 |
6,670,978 |
7,528,186 |
8,432,594 |
9,885,423 |
17.2% |
| Service |
30,950,687 |
31,322,069 |
33,743,954 |
35,313,798 |
39,120,411 |
50,584,834 |
53,057,854 |
4.9% |
| Total |
203,199,870 |
212,442,617 |
203,842,475 |
215,872,824 |
229,109,164 |
262,327,331 |
271,731,123 |
3.6% |
| Annual
Change |
|
4.5% |
-4.0% |
5.9% |
6.1% |
14.5% |
3.6% |
|
|


