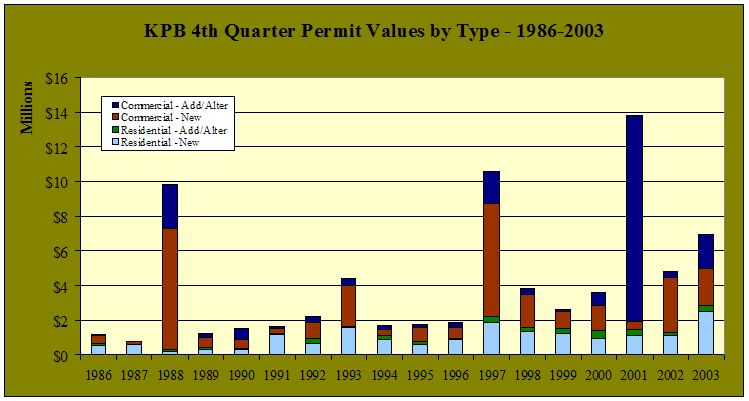
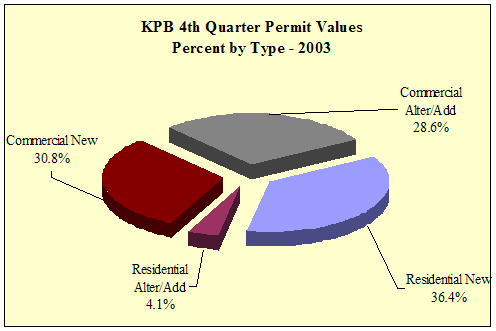
| KPB 4th
Quarter Permit Values by Type - 1997-2003 - in $ |
| |
1997 |
1998 |
1999 |
2000 |
2001 |
2002 |
2003 |
Annual
Change |
| Residential
New |
1,918,300 |
1,352,750 |
1,245,888 |
972,668 |
1,116,300 |
1,113,200 |
2,528,091 |
127.1% |
| Residential
Alter/Add |
306,500 |
234,960 |
286,400 |
434,300 |
343,948 |
205,620 |
288,000 |
40.1% |
| Commercial
New |
6,504,650 |
1,868,000 |
962,905 |
1,462,484 |
514,000 |
3,168,000 |
2,139,491 |
-32.5% |
| Commercial
Alter/Add |
1,861,469 |
404,100 |
135,600 |
749,082 |
11,848,000 |
345,800 |
1,988,363 |
475.0% |
| Total |
10,590,919 |
3,859,810 |
2,630,793 |
3,618,534 |
13,822,248 |
4,832,620 |
6,943,945 |
43.7% |
| Annual
Change |
|
-63.6% |
-31.8% |
37.5% |
282.0% |
-65.0% |
43.7% |
|
|


