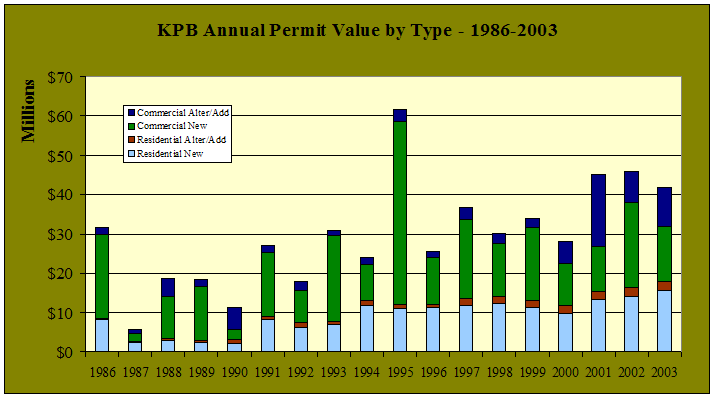
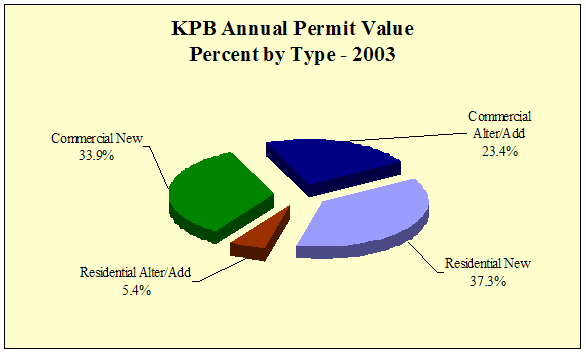
| KPB Annual
Permit Value by Type - 1997-2003 - in $ |
| |
1997 |
1998 |
1999 |
2000 |
2001 |
2002 |
2003 |
Annual
Change |
| Residential
New |
11,861,406 |
12,376,250 |
11,235,862 |
9,840,058 |
13,356,633 |
14,050,064 |
15,553,888 |
10.7% |
| Residential
Alter/Add |
1,718,057 |
1,747,903 |
1,798,828 |
1,929,699 |
1,985,969 |
2,257,315 |
2,246,779 |
-0.5% |
| Commercial
New |
20,021,950 |
13,494,922 |
18,598,564 |
10,662,544 |
11,565,350 |
21,793,729 |
14,127,701 |
-35.2% |
| Commercial
Alter/Add |
3,081,855 |
2,592,678 |
2,495,029 |
5,713,756 |
18,143,591 |
7,821,668 |
9,775,309 |
25.0% |
| Total |
36,683,268 |
30,211,753 |
34,128,283 |
28,146,057 |
45,051,543 |
45,922,776 |
41,703,677 |
-9.2% |
| Annual
Change |
|
-17.6% |
13.0% |
-17.5% |
60.1% |
1.9% |
-9.2% |
|
|


