| Seward
4th Quarter Gross Sales by Industry - 1997-2003 - in $ |
| |
1997 |
1998 |
1999 |
2000 |
2001 |
2002 |
2003 |
Annual
Change |
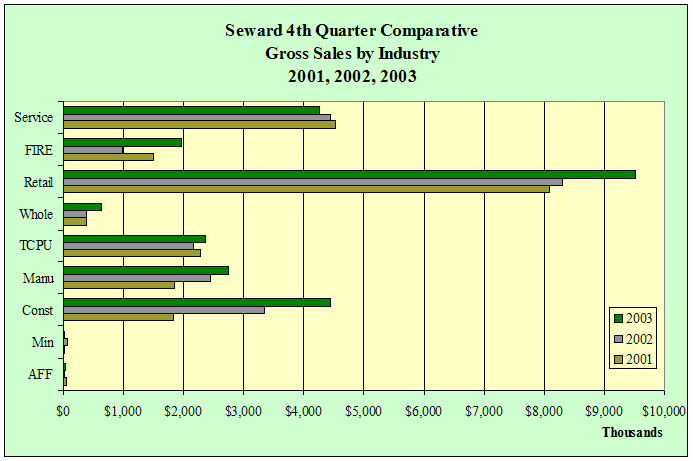
| AFF |
62,997 |
90,340 |
31,488 |
40,523 |
58,049 |
24,693 |
39,444 |
59.7% |
| Min |
51,796 |
31,075 |
66,592 |
40,697 |
32,041 |
63,985 |
23,151 |
NA
|
| Const |
8,333,138 |
6,384,946 |
2,311,393 |
7,398,448 |
1,824,093 |
3,340,899 |
4,444,181 |
33.0% |
| Manu |
1,264,534 |
697,604 |
1,302,849 |
2,623,829 |
1,838,613 |
2,450,766 |
2,744,650 |
12.0% |
| TCPU |
2,438,016 |
2,803,354 |
2,239,802 |
2,865,153 |
2,276,587 |
2,174,323 |
2,367,047 |
8.9% |
| Whole |
1,982,543 |
906,662 |
396,641 |
387,717 |
382,240 |
394,120 |
631,489 |
60.2% |
| Retail |
6,956,004 |
7,351,448 |
7,960,253 |
8,068,766 |
8,078,507 |
8,299,519 |
9,507,542 |
14.6% |
| FIRE |
1,766,768 |
2,189,494 |
1,822,797 |
2,116,406 |
1,494,179 |
986,236 |
1,977,860 |
100.5% |
| Service |
5,392,137 |
3,572,072 |
4,115,849 |
4,248,827 |
4,519,365 |
4,453,084 |
4,256,775 |
-4.4% |
| Total |
28,247,933 |
24,026,995 |
20,247,664 |
27,790,366 |
20,503,674 |
22,187,625 |
25,992,139 |
17.1% |
| Annual
Change |
|
-14.9% |
-15.7% |
37.3% |
-26.2% |
8.2% |
17.1% |
|
|