| Soldotna
4th Quarter Permit Values by Type - 1997-2003 - in $ |
| |
1997 |
1998 |
1999 |
2000 |
2001 |
2002 |
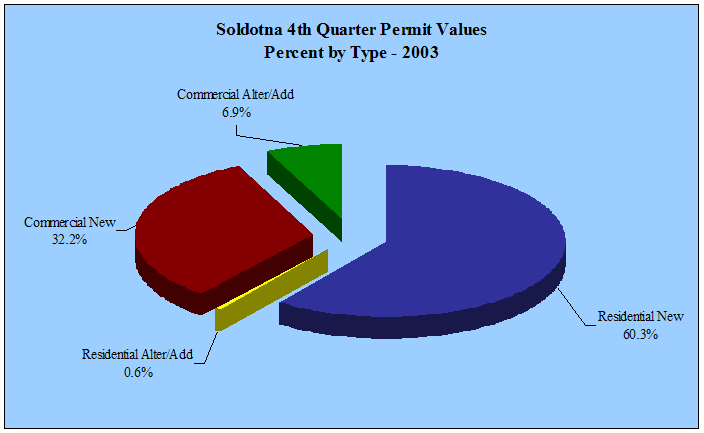
2003 |
Annual
Change |
| Residential
New |
733,300 |
175,000 |
225,888 |
270,668 |
0 |
176,000 |
526,191 |
199.0% |
| Residential
Alter/Add |
30,000 |
11,660 |
0 |
39,500 |
51,148 |
11,500 |
5,000 |
-56.5% |
| Commercial
New |
16,650 |
300,000 |
281,905 |
970,484 |
0 |
0 |
281,491 |
NA
|
| Commercial
Alter/Add |
780,500 |
272,500 |
2,000 |
122,300 |
111,500 |
70,000 |
60,363 |
-13.8% |
| Total |
1,560,450 |
759,160 |
509,793 |
1,402,952 |
162,648 |
257,500 |
873,045 |
239.0% |
| Annual
Change |
|
-51.3% |
-32.8% |
175.2% |
-88.4% |
58.3% |
239.0% |
|
|