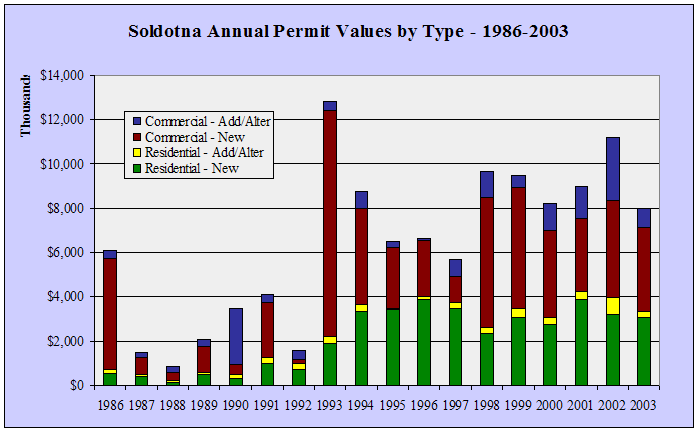
| Soldotna
Annual Permit Values by Type - 1997-2003 - in $ |
| |
1997 |
1998 |
1999 |
2000 |
2001 |
2002 |
2003 |
Annual
Change |
| Residential
New |
3,489,756 |
2,347,000 |
3,048,462 |
2,709,018 |
3,873,853 |
3,181,344 |
3,073,933 |
-3.4% |
| Residential
Alter/Add |
241,900 |
237,060 |
377,228 |
365,239 |
357,495 |
755,187 |
263,629 |
-65.1% |
| Commercial
New |
1,164,150 |
5,890,665 |
5,501,539 |
3,924,064 |
3,288,822 |
4,397,059 |
3,769,181 |
NA
|
| Commercial
Alter/Add |
783,500 |
1,147,092 |
577,891 |
1,169,099 |
1,434,802 |
2,830,304 |
845,554 |
-70.1% |
| Total |
5,679,306 |
9,621,817 |
9,505,120 |
8,167,420 |
8,954,972 |
11,163,894 |
7,952,297 |
-28.8% |
| Annual
Change |
|
69.4% |
-1.2% |
-14.1% |
9.6% |
24.7% |
-28.8% |
|
|


