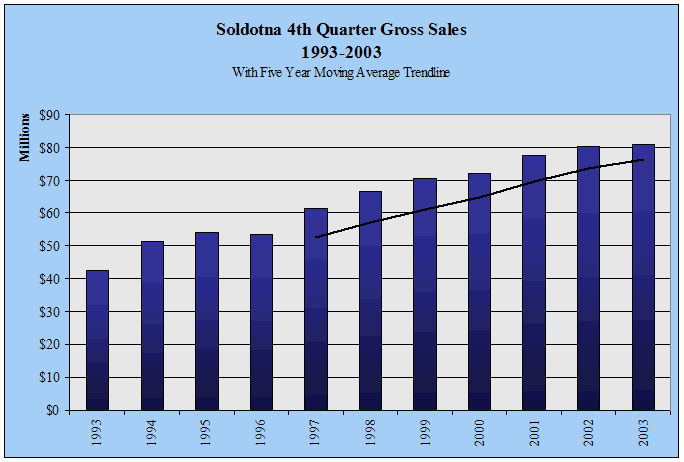
| Soldotna
4th Quarter Gross Sales by Industry - 1997-2003 - in $ |
| |
1997 |
1998 |
1999 |
2000 |
2001 |
2002 |
2003 |
Annual
Change |
| AFF |
96,744 |
122,431 |
217,744 |
262,358 |
269,662 |
461,273 |
686,965 |
48.9% |
| Min |
310,435 |
1,135,353 |
81,064 |
100,575 |
53,304 |
119,470 |
118,412 |
-0.9% |
| Const |
6,853,740 |
6,231,433 |
6,309,023 |
6,093,210 |
4,897,000 |
5,990,804 |
6,010,806 |
0.3% |
| Manu |
605,405 |
726,600 |
651,359 |
1,433,479 |
1,261,012 |
1,321,057 |
1,459,149 |
10.5% |
| TCPU |
3,415,512 |
3,724,804 |
4,480,636 |
3,990,606 |
3,904,674 |
3,782,935 |
4,598,976 |
21.6% |
| Whole |
2,742,526 |
5,161,109 |
7,569,235 |
4,719,082 |
6,765,030 |
12,251,677 |
6,759,341 |
-44.8% |
| Retail |
38,909,421 |
40,355,055 |
41,728,045 |
45,263,100 |
49,356,300 |
45,494,387 |
49,248,267 |
8.3% |
| FIRE |
2,031,268 |
1,646,315 |
2,068,526 |
2,355,055 |
2,910,221 |
2,632,224 |
2,888,107 |
9.7% |
| Service |
6,449,638 |
7,490,625 |
7,470,400 |
7,788,219 |
8,183,085 |
8,100,682 |
9,171,095 |
13.2% |
| Total |
61,417,298 |
66,596,151 |
70,579,609 |
72,007,899 |
77,601,488 |
80,158,239 |
80,949,644 |
1.0% |
| Annual
Change |
|
8.4% |
6.0% |
2.0% |
7.8% |
3.3% |
1.0% |
|
|


