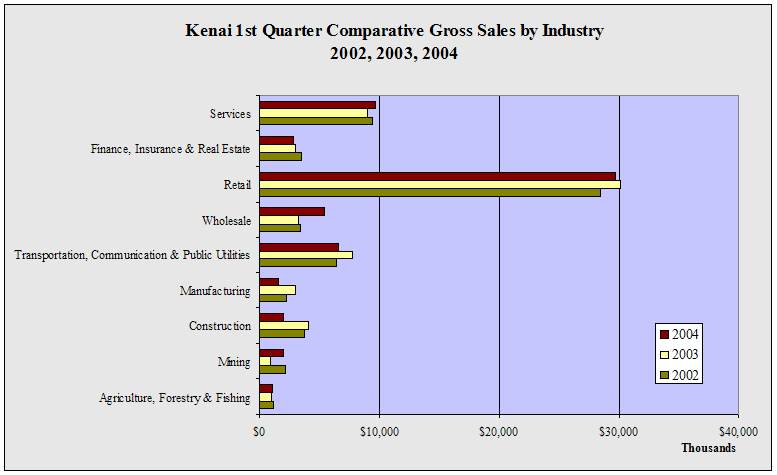
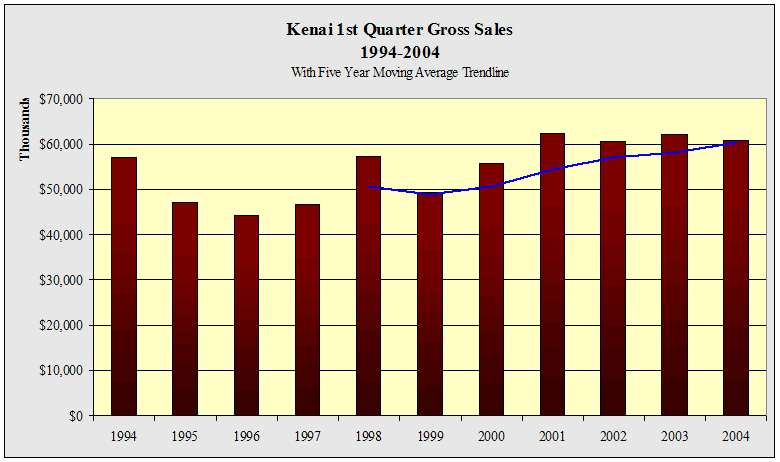
| Kenai 1st Quarter Gross Sales by Industry - 1998-2004 - in $ |
| |
1998 |
1999 |
2000 |
2001 |
2002 |
2003 |
2004 |
Annual
Change |
| Agriculture,
Forestry & Fishing |
1,038,779 |
629,110 |
1,289,933 |
633,357 |
1,170,314 |
1,002,650 |
1,061,786 |
5.9% |
| Mining |
22,409 |
37,476 |
1,537,438 |
852,594 |
2,214,717 |
942,570 |
2,011,733 |
113.4% |
| Construction |
2,720,090 |
3,055,890 |
3,678,541 |
1,914,204 |
3,744,640 |
4,108,571 |
1,964,768 |
-52.2% |
| Manufacturing |
1,526,259 |
1,475,182 |
2,268,724 |
2,808,918 |
2,256,153 |
2,997,006 |
1,585,364 |
-47.1% |
| Transportation,
Communication & Public Utilities |
5,699,415 |
6,364,713 |
6,345,750 |
6,131,576 |
6,463,060 |
7,749,766 |
6,572,670 |
-15.2% |
| Wholesale |
1,782,125 |
1,912,703 |
2,723,434 |
4,987,946 |
3,364,888 |
3,221,739 |
5,447,260 |
69.1% |
| Retail |
33,813,539 |
27,061,077 |
27,945,524 |
34,150,036 |
28,474,145 |
30,074,057 |
29,646,754 |
-1.4% |
| Finance,
Insurance & Real Estate |
2,337,453 |
2,650,247 |
2,518,820 |
2,962,348 |
3,439,155 |
3,050,602 |
2,834,399 |
-7.1% |
| Services |
8,458,094 |
6,123,394 |
7,301,212 |
7,970,815 |
9,431,370 |
8,956,347 |
9,653,718 |
7.8% |
| Total |
57,398,212 |
49,309,897 |
55,609,576 |
62,411,794 |
60,558,442 |
62,103,308 |
60,778,452 |
-2.1% |
| Annual
Change |
|
-14.1% |
12.8% |
12.2% |
-3.0% |
2.6% |
-2.1% |
|
|


