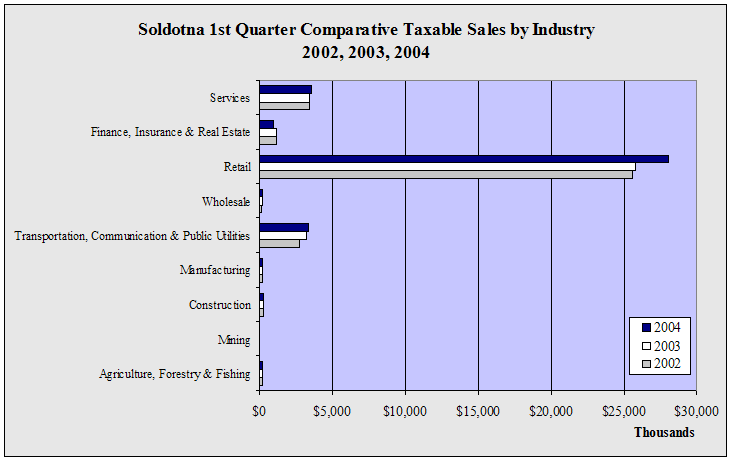
| Soldotna
1st Quarter Taxable Sales by Industry - 1998-2004 - in $ |
| |
1998 |
1999 |
2000 |
2001 |
2002 |
2003 |
2004 |
Annual
Change |
| Agriculture,
Forestry & Fishing |
87,616 |
94,556 |
148,104 |
183,856 |
185,252 |
167,593 |
211,398 |
26.1% |
| Mining |
2,962 |
0 |
1,148 |
7,612 |
6,447 |
9,374 |
6,675 |
-28.8% |
| Construction |
296,806 |
295,263 |
316,000 |
234,518 |
283,099 |
301,760 |
309,219 |
2.5% |
| Manufacturing |
243,826 |
199,670 |
194,558 |
199,966 |
181,486 |
219,705 |
204,357 |
-7.0% |
| Transportation,
Communication & Public Utilities |
2,294,730 |
2,544,919 |
2,608,749 |
2,584,193 |
2,752,273 |
3,219,035 |
3,379,681 |
5.0% |
| Wholesale |
51,570 |
59,914 |
71,213 |
124,637 |
135,437 |
173,053 |
154,053 |
-11.0% |
| Retail |
20,466,847 |
21,325,306 |
22,423,668 |
25,030,145 |
25,570,526 |
25,769,374 |
28,020,061 |
8.7% |
| Finance,
Insurance & Real Estate |
787,528 |
858,013 |
860,411 |
1,072,034 |
1,170,633 |
1,141,419 |
957,380 |
-16.1% |
| Services |
2,946,714 |
3,049,461 |
3,033,282 |
3,040,671 |
3,442,688 |
3,443,108 |
3,534,696 |
2.7% |
| Total |
27,184,841 |
28,439,928 |
29,664,420 |
32,484,139 |
33,734,541 |
34,456,740 |
36,784,424 |
6.8% |
| Annual
Change |
|
4.6% |
4.3% |
9.5% |
3.8% |
2.1% |
6.8% |
|
|


