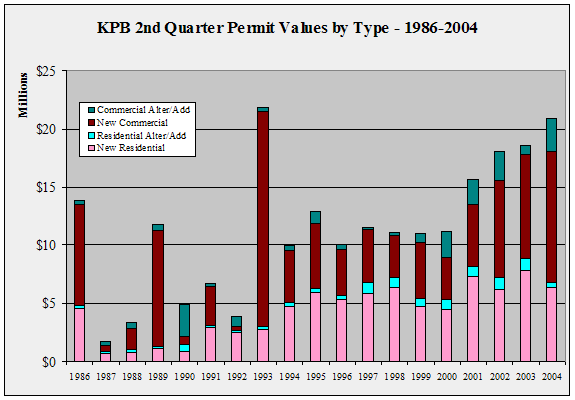
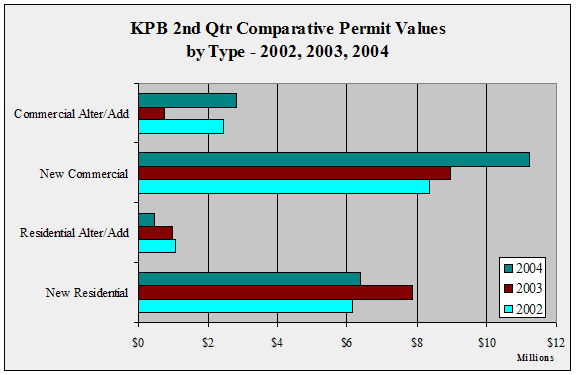
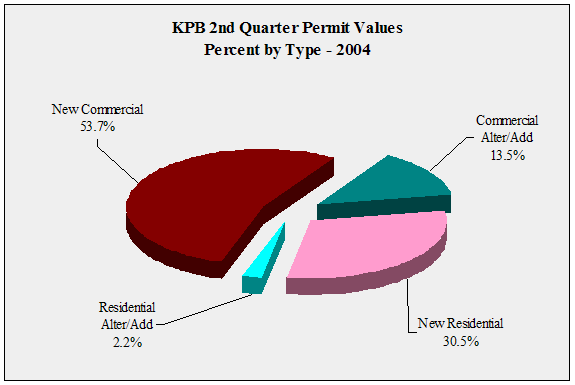
| KPB 2nd Quarter Permit Values by Type -
1998-2004 - in $ |
| |
1998 |
1999 |
2000 |
2001 |
2002 |
2003 |
2004 |
Annual
Change |
| New
Residential |
6,367,500 |
4,754,674 |
4,531,931 |
7,367,801 |
6,145,753 |
7,868,834 |
6,374,487 |
-19.0% |
| Residential
Alter/Add |
879,900 |
667,961 |
860,574 |
758,779 |
1,044,943 |
984,340 |
462,122 |
-53.1% |
| New
Commercial |
3,600,436 |
4,798,818 |
3,564,122 |
5,384,800 |
8,376,305 |
8,965,210 |
11,223,615 |
25.2% |
| Commercial
Alter/Add |
280,000 |
724,813 |
2,269,349 |
2,110,989 |
2,430,953 |
745,400 |
2,822,063 |
278.6% |
| Total |
11,127,836 |
10,946,266 |
11,225,976 |
15,622,369 |
17,997,954 |
18,563,784 |
20,882,287 |
12.5% |
| Annual
Change |
|
-1.6% |
2.6% |
39.2% |
15.2% |
3.1% |
12.5% |
|
|


