Kenai
Peninsula Borough
Community and Economic
Development Division
Quarterly Report
of Key Economic Indicators for Period Ending June
30, 2004
|
Kenai
Peninsula Borough Construction |
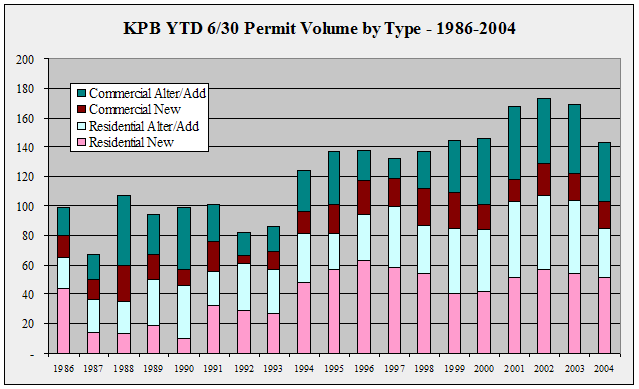
| KPB YTD 6/30 Permit Volume by
Type - 1998-2004 |
| |
1998 |
1999 |
2000 |
2001 |
2002 |
2003 |
2004 |
Annual
Change |
| Residential
New |
54 |
41 |
42 |
52 |
57 |
54 |
51 |
-5.6% |
| Residential
Alter/Add |
33 |
44 |
42 |
51 |
50 |
50 |
34 |
-32.0% |
| Commercial
New |
25 |
24 |
17 |
15 |
22 |
18 |
18 |
0.0% |
| Commercial
Alter/Add |
25 |
35 |
45 |
50 |
44 |
47 |
40 |
-14.9% |
| Total |
137 |
144 |
146 |
168 |
173 |
169 |
143 |
-15.4% |
| Annual
Change |
|
5.1% |
1.4% |
15.1% |
3.0% |
-2.3% |
-15.4% |
|
|
 |
 |
 |


