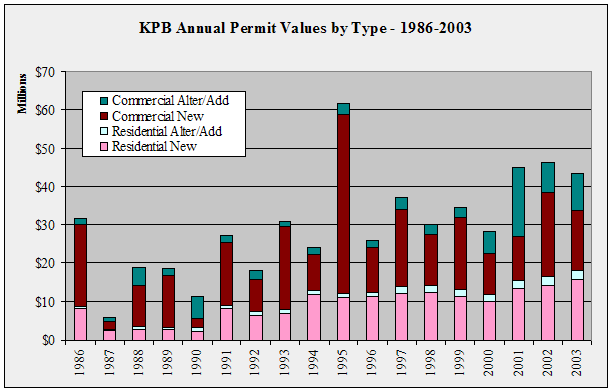
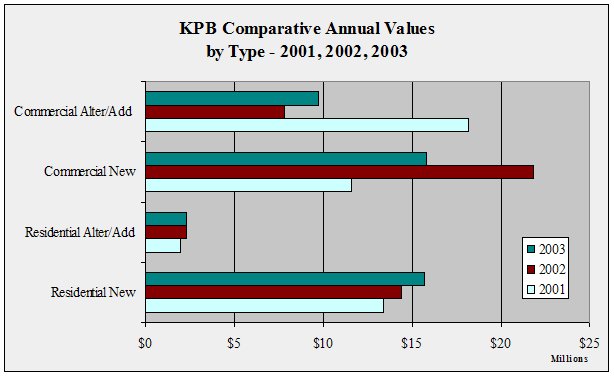
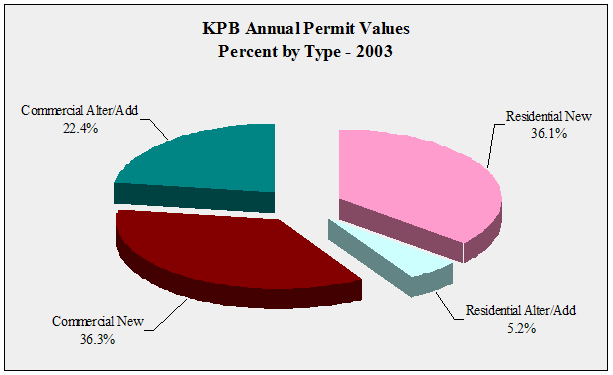
| KPB Annual Permit Values by Type - 1997-2003-
in $ |
| |
1997 |
1998 |
1999 |
2000 |
2001 |
2002 |
2003 |
Annual
Change |
| Residential
New |
12,196,406 |
12,376,250 |
11,395,862 |
9,885,058 |
13,391,633 |
14,358,064 |
15,729,888 |
9.6% |
| Residential
Alter/Add |
1,777,957 |
1,747,903 |
1,834,828 |
1,990,399 |
1,996,494 |
2,305,815 |
2,280,779 |
-1.1% |
| Commercial
New |
20,059,950 |
13,494,922 |
18,862,564 |
10,662,544 |
11,565,350 |
21,793,729 |
15,820,201 |
-27.4% |
| Commercial
Alter/Add |
3,081,855 |
2,592,678 |
2,514,029 |
5,717,256 |
18,163,591 |
7,821,668 |
9,775,309 |
25.0% |
| Total |
37,116,168 |
30,211,753 |
34,607,283 |
28,255,257 |
45,117,068 |
46,279,276 |
43,606,177 |
-5.8% |
| Annual Change |
|
-18.6% |
14.5% |
-18.4% |
59.7% |
2.6% |
-5.8% |
|
|


