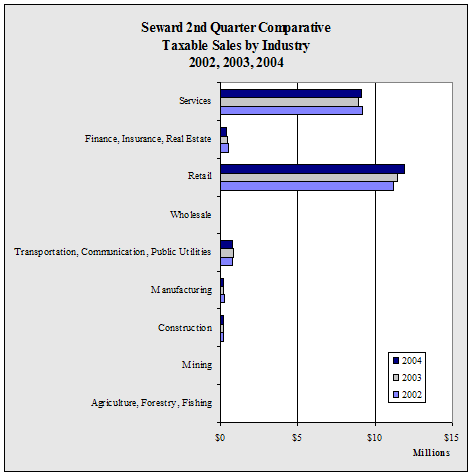
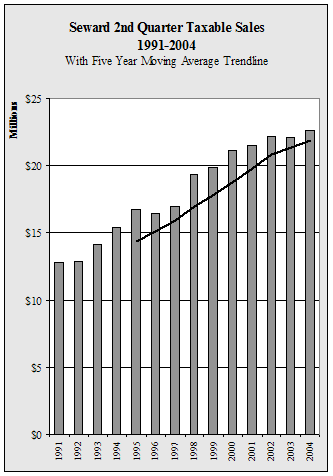
| Seward
2nd Quarter Taxable Sales by Industry - 1998-2004 - in $ |
| |
1998 |
1999 |
2000 |
2001 |
2002 |
2003 |
2004 |
Annual
Change |
| Agriculture,
Forestry, Fishing |
67,854 |
65,022 |
79,544 |
69,770 |
57,747 |
70,505 |
77,870 |
10.4% |
| Mining |
0 |
0 |
500 |
0 |
0 |
1,754 |
0 |
-100.0% |
| Construction |
174,297 |
169,218 |
193,381 |
160,218 |
140,758 |
190,057 |
197,544 |
3.9% |
| Manufacturing |
180,192 |
163,167 |
177,059 |
312,269 |
299,221 |
157,138 |
162,634 |
3.5% |
| Transportation,
Communication, Public Utilities |
997,822 |
959,392 |
1,115,553 |
795,426 |
780,744 |
806,380 |
756,932 |
-6.1% |
| Wholesale |
93,123 |
47,534 |
49,015 |
41,804 |
38,741 |
40,058 |
34,969 |
-12.7% |
| Retail |
9,520,762 |
9,619,860 |
10,592,090 |
10,866,501 |
11,179,774 |
11,465,828 |
11,931,059 |
4.1% |
| Finance,
Insurance, Real Estate |
412,833 |
457,658 |
411,656 |
433,701 |
488,696 |
415,752 |
358,010 |
-13.9% |
| Services |
7,925,473 |
8,425,335 |
8,542,100 |
8,873,245 |
9,191,230 |
8,932,536 |
9,136,466 |
2.3% |
| Total |
19,372,356 |
19,907,186 |
21,160,898 |
21,552,934 |
22,176,911 |
22,080,008 |
22,655,484 |
2.6% |
| Annual
Change |
|
2.8% |
6.3% |
1.9% |
2.9% |
-0.4% |
2.6% |
|
|


