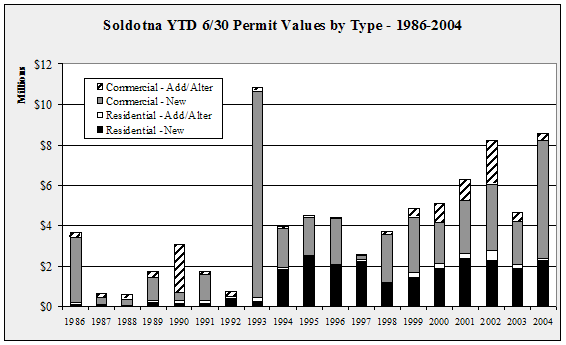
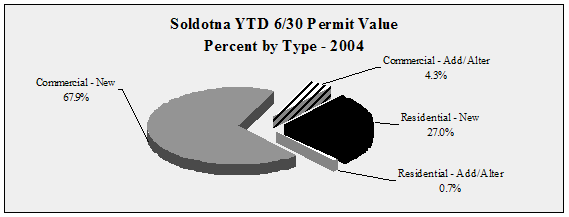
| Soldotna YTD 6/30 Permit Values
by Type - 1998-2004 - in $ |
| |
1998 |
1999 |
2000 |
2001 |
2002 |
2003 |
2004 |
Annual
Change |
| Residential
- New |
1,110,000 |
1,453,674 |
1,894,420 |
2,363,001 |
2,316,142 |
1,899,354 |
2,316,384 |
22.0% |
| Residential
- Add/Alter |
122,000 |
235,361 |
224,674 |
256,199 |
426,221 |
187,907 |
64,092 |
-65.9% |
| Commercial
- New |
2,339,952 |
2,723,818 |
2,017,915 |
2,658,578 |
3,316,381 |
2,116,490 |
5,824,623 |
175.2% |
| Commercial
- Add/Alter |
151,542 |
455,895 |
950,549 |
1,004,630 |
2,150,304 |
457,191 |
372,800 |
-18.5% |
| TOTAL |
3,723,494 |
4,868,748 |
5,087,558 |
6,282,408 |
8,209,048 |
4,660,942 |
8,577,899 |
84.0% |
| Annual
Change |
|
30.8% |
4.5% |
23.5% |
30.7% |
-43.2% |
84.0% |
|
|


