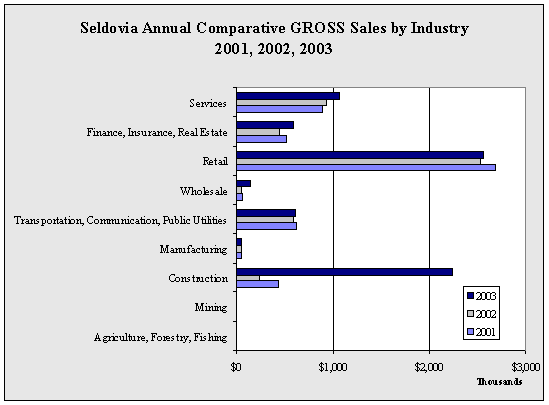
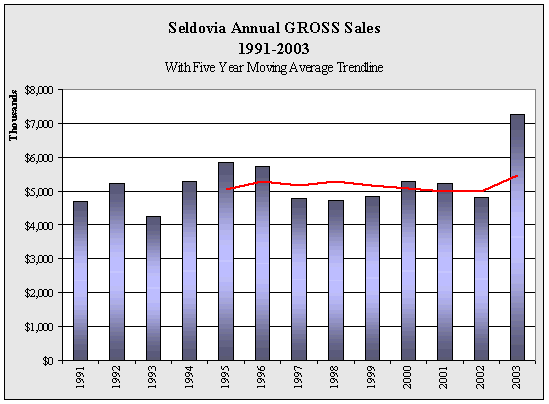
| Seldovia
Annual GROSS Sales by Industry - 1997-2003 - in $ |
| |
1997 |
1998 |
1999 |
2000 |
2001 |
2002 |
2003 |
Annual
Change |
| Agriculture,
Forestry, Fishing |
2,554 |
3,422 |
3,084 |
2,797 |
3,787 |
6,306 |
5,737 |
-9.0% |
| Mining |
0 |
0 |
0 |
0 |
0 |
0 |
0 |
NA |
| Construction |
302,722 |
302,999 |
200,475 |
567,881 |
427,249 |
233,790 |
2,235,069 |
856.0% |
| Manufacturing |
16,468 |
53,202 |
142,303 |
22,483 |
40,983 |
41,694 |
44,136 |
5.9% |
| Transportation,
Communication, Public Utilities |
652,000 |
724,009 |
702,895 |
642,067 |
615,305 |
589,101 |
609,377 |
3.4% |
| Wholesale |
938,201 |
886,557 |
466,249 |
74,511 |
58,140 |
40,755 |
143,974 |
253.3% |
| Retail |
1,682,862 |
1,698,659 |
2,359,533 |
2,969,768 |
2,686,700 |
2,525,108 |
2,561,305 |
1.4% |
| Finance,
Insurance, Real Estate |
311,648 |
134,421 |
111,959 |
62,750 |
509,244 |
443,797 |
590,854 |
33.1% |
| Services |
866,800 |
920,470 |
858,272 |
925,068 |
884,899 |
935,363 |
1,065,108 |
13.9% |
| Total |
4,773,255 |
4,723,739 |
4,844,770 |
5,267,325 |
5,226,307 |
4,815,914 |
7,255,560 |
50.7% |
| Annual
Change |
|
-1.0% |
2.6% |
8.7% |
-0.8% |
-7.9% |
50.7% |
|
|


