| Seward
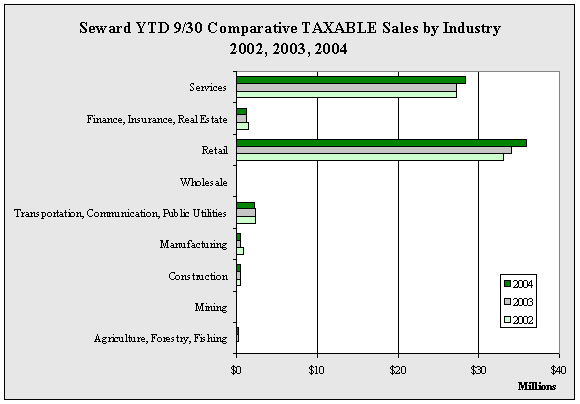
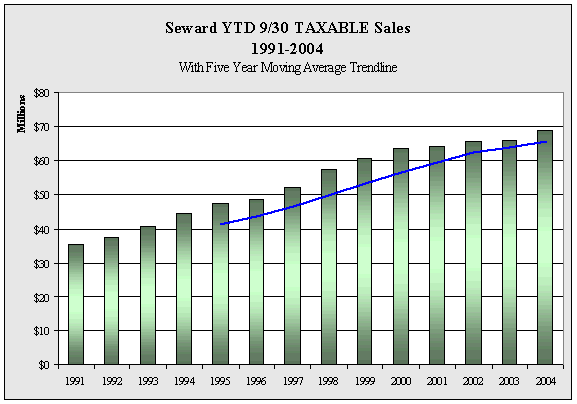
YTD 9/30 TAXABLE Sales by Industry - 1998-2004 - in $ |
| |
1998 |
1999 |
2000 |
2001 |
2002 |
2003 |
2004 |
Annual
Change |
| Agriculture,
Forestry, Fishing |
123,883 |
114,343 |
225,079 |
155,662 |
104,078 |
199,127 |
219,537 |
10.2% |
| Mining |
0 |
1,444 |
500 |
0 |
0 |
3,455 |
0 |
NA |
| Construction |
515,927 |
533,853 |
517,365 |
436,636 |
424,498 |
491,863 |
549,903 |
11.8% |
| Manufacturing |
398,464 |
460,274 |
472,654 |
839,471 |
866,516 |
485,838 |
441,783 |
-9.1% |
Transportation,
Communication,
Public Utilities |
3,094,374 |
3,008,624 |
3,285,602 |
2,333,956 |
2,332,637 |
2,336,344 |
2,165,180 |
-7.3% |
| Wholesale |
362,843 |
104,788 |
119,117 |
124,631 |
90,227 |
104,775 |
93,195 |
-11.1% |
| Retail |
27,944,674 |
29,755,170 |
31,483,263 |
32,216,388 |
33,034,211 |
33,963,329 |
35,893,398 |
5.7% |
Finance,
Insurance,
Real Estate |
1,244,528 |
1,310,450 |
1,188,935 |
1,278,812 |
1,436,652 |
1,276,643 |
1,230,731 |
-3.6% |
| Services |
23,820,972 |
25,625,986 |
26,146,216 |
26,831,594 |
27,276,259 |
27,217,774 |
28,360,083 |
4.2% |
| Total |
57,505,665 |
60,914,932 |
63,438,731 |
64,217,150 |
65,565,078 |
66,079,148 |
68,953,810 |
4.4% |
| Annual
Change |
|
5.9% |
4.1% |
1.2% |
2.1% |
0.8% |
4.4% |
|
|


