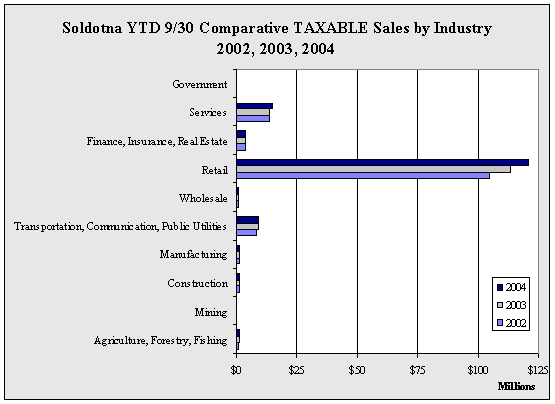
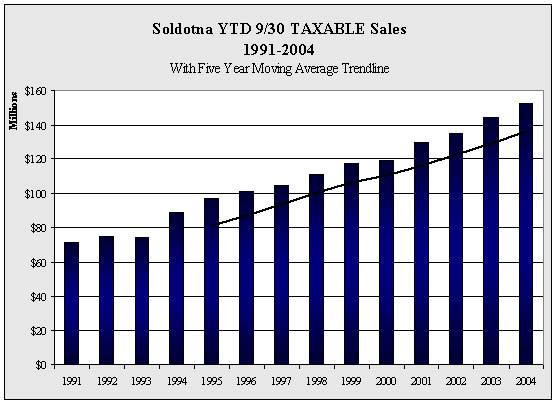
| Soldotna
YTD 9/30 TAXABLE Sales by Industry - 1998-2004 - in $ |
| |
1998 |
1999 |
2000 |
2001 |
2002 |
2003 |
2004 |
Annual
Change |
| Agriculture,
Forestry, Fishing |
352,026 |
513,472 |
722,179 |
911,120 |
865,338 |
922,887 |
934,277 |
1.2% |
| Mining |
6,510 |
4,215 |
10,095 |
26,816 |
21,697 |
24,660 |
15,123 |
-38.7% |
| Construction |
980,704 |
1,107,447 |
936,249 |
889,468 |
982,300 |
1,197,494 |
1,045,500 |
-12.7% |
| Manufacturing |
1,180,264 |
1,201,201 |
1,323,915 |
1,341,850 |
1,321,142 |
1,395,734 |
1,366,406 |
-2.1% |
Transportation,
Communication,
Public Utilities |
6,959,460 |
7,587,129 |
7,793,164 |
7,823,274 |
8,316,315 |
9,142,862 |
9,265,043 |
1.3% |
| Wholesale |
306,261 |
240,397 |
573,422 |
657,940 |
617,727 |
800,989 |
671,922 |
-16.1% |
| Retail |
86,315,360 |
91,390,900 |
92,220,749 |
101,843,920 |
104,839,901 |
113,488,163 |
120,916,704 |
6.5% |
Finance,
Insurance,
Real Estate |
2,755,558 |
2,896,505 |
3,302,728 |
3,846,126 |
3,939,711 |
3,452,500 |
3,371,976 |
-2.3% |
| Services |
12,083,614 |
12,179,641 |
12,056,871 |
12,169,177 |
13,806,185 |
13,600,062 |
14,575,053 |
7.2% |
| Government |
15,795 |
24,822 |
14,847 |
17,903 |
18,849 |
33,191 |
18,305 |
-44.8% |
| Total |
110,955,552 |
117,145,729 |
118,954,219 |
129,527,594 |
134,729,165 |
144,058,542 |
152,180,309 |
5.6% |
| Annual
Change |
|
5.6% |
1.5% |
8.9% |
4.0% |
6.9% |
5.6% |
|
|


