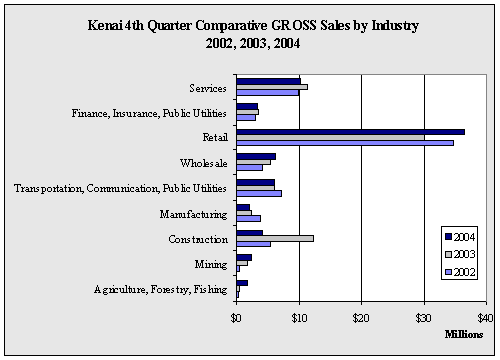
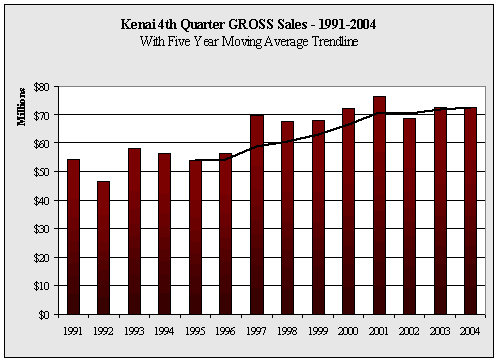
| Kenai 4th Quarter GROSS Sales by Industry - 1998-2004 - in $ |
| |
1998 |
1999 |
2000 |
2001 |
2002 |
2003 |
2004 |
Annual
Change |
| Agriculture,
Forestry, Fishing |
2,414,459 |
1,208,946 |
147,395 |
825,507 |
227,354 |
470,121 |
1,748,879 |
272.0% |
| Mining |
21,156 |
911,206 |
1,357,532 |
520,572 |
379,608 |
1,583,457 |
2,357,708 |
48.9% |
| Construction |
5,761,348 |
7,663,858 |
4,782,252 |
6,858,111 |
5,458,971 |
12,200,692 |
4,088,311 |
-66.5% |
| Manufacturing |
1,826,500 |
2,053,148 |
2,807,139 |
2,894,059 |
3,767,980 |
2,258,019 |
2,037,898 |
-9.7% |
| Transportation,
Communication, Public Utilities |
5,893,200 |
8,441,455 |
6,008,325 |
6,372,561 |
7,120,726 |
5,941,515 |
5,999,635 |
1.0% |
| Wholesale |
2,383,031 |
2,774,886 |
5,106,481 |
4,233,797 |
4,069,622 |
5,333,838 |
6,326,294 |
18.6% |
| Retail |
38,027,088 |
34,505,929 |
40,741,748 |
41,619,799 |
34,670,657 |
30,062,588 |
36,602,736 |
21.8% |
| Finance,
Insurance, Public Utilities |
2,571,040 |
2,586,301 |
3,355,291 |
3,810,903 |
3,049,232 |
3,350,119 |
3,233,035 |
-3.5% |
| Services |
8,711,175 |
7,804,528 |
8,102,564 |
9,287,393 |
9,873,954 |
11,345,461 |
10,171,821 |
-10.3% |
| Government |
93 |
72 |
32 |
0 |
0 |
0 |
0 |
NA
|
| Total |
67,609,090 |
67,950,329 |
72,408,759 |
76,422,702 |
68,618,104 |
72,545,810 |
72,566,317 |
0.03% |
| Annual
Change |
|
0.5% |
6.6% |
5.5% |
-10.2% |
5.7% |
0.03% |
|
|


