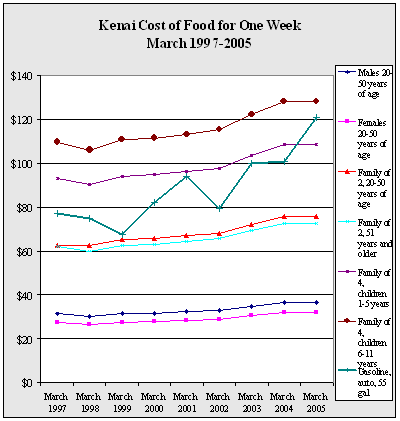
| KENAI/SOLDOTNA |
| |
March
1997 |
March
1998 |
March
1999 |
March
2000 |
March
2001 |
March
2002 |
March
2003 |
March
2004 |
March
2005 |
Annual
Change |
| Sales
Tax (in percent) |
5.0 |
5.0 |
5.0 |
5.0 |
5.0 |
5.0 |
5.0 |
5.0 |
5.0 |
|
| Percent
of Food Unavailable |
0.0 |
0.0 |
0.0 |
1.0 |
1.0 |
0.0 |
1.0 |
0.0 |
0.0 |
|
| |
| Child,
1 year |
16.4 |
15.9 |
16.6 |
16.7 |
16.8 |
17.1 |
18.1 |
19.2 |
19.1 |
-0.6% |
| Child,
2 years |
0.0 |
0.0 |
0.0 |
0.0 |
0.0 |
17.1 |
18.1 |
18.9 |
18.9 |
-0.2% |
| Children
3-5 years of age |
22.2 |
17.4 |
18.2 |
14.7 |
18.4 |
18.7 |
19.9 |
20.8 |
20.8 |
0.4% |
| Children
6-8 years of age |
23.8 |
23.0 |
24.2 |
18.1 |
24.5 |
25.0 |
26.6 |
28.0 |
27.9 |
-0.3% |
| Children
9-11 years of age |
27.0 |
26.2 |
27.5 |
27.5 |
27.8 |
28.3 |
30.1 |
31.5 |
31.4 |
-0.2% |
| |
| Males
12-14 years of age |
30.6 |
29.5 |
31.0 |
31.1 |
31.5 |
32.0 |
33.9 |
35.4 |
35.5 |
0.2% |
| Males
15-19 years of age |
31.5 |
30.4 |
31.9 |
32.0 |
32.5 |
33.0 |
34.9 |
36.5 |
36.6 |
0.2% |
| Males
20-50 years of age |
31.3 |
30.2 |
31.6 |
31.8 |
32.4 |
33.0 |
35.0 |
36.6 |
36.7 |
0.2% |
| Males
51 and older |
29.9 |
28.9 |
30.1 |
30.3 |
30.8 |
31.5 |
33.3 |
34.9 |
35.0 |
0.1% |
| |
| Females
12-19 years of age |
26.4 |
25.5 |
26.7 |
26.8 |
27.2 |
27.6 |
29.2 |
30.7 |
30.7 |
0.2% |
| Females
20-50 years of age |
27.5 |
26.6 |
27.6 |
27.8 |
28.4 |
28.9 |
30.6 |
32.0 |
32.0 |
-0.1% |
| Females
51 and older |
26.7 |
25.7 |
26.8 |
27.0 |
27.6 |
28.1 |
29.7 |
31.0 |
31.1 |
0.2% |
| |
| Family
of 2, 20-50 years of age |
62.7 |
62.5 |
65.1 |
65.5 |
66.8 |
68.1 |
72.2 |
75.4 |
75.5 |
0.1% |
| Family
of 2, 51 years and older |
62.2 |
60.1 |
62.6 |
63.0 |
64.2 |
65.5 |
69.4 |
72.5 |
72.6 |
0.2% |
| Family
of 4, children 1-5 years |
93.1 |
90.0 |
94.0 |
94.5 |
96.0 |
97.7 |
103.6 |
108.2 |
108.3 |
0.1% |
| Family
of 4, children 6-11 years |
109.6 |
105.9 |
110.9 |
111.4 |
113.1 |
115.2 |
122.2 |
128.1 |
127.9 |
-0.1% |
| |
| Electricity,
1000 kWh |
111.0 |
119.9 |
120.7 |
119.4 |
111.9 |
122.1 |
124.4 |
100.8 |
115.4 |
14.4% |
| Gasoline,
auto, 55 gal |
77.0 |
74.8 |
67.3 |
82.0 |
94.1 |
79.5 |
100.1 |
100.7 |
120.5 |
19.7% |
| Lumber,
2X4X8' |
3.9 |
3.3 |
3.5 |
3.6 |
3.0 |
3.1 |
3.3 |
3.0 |
3.3 |
8.2% |
| Propane,
100 lb. refill |
39.5 |
39.5 |
34.9 |
42.5 |
49.6 |
43.4 |
54.0 |
49.1 |
56.6 |
15.4% |
| Sewer
& Water, monthly |
41.6 |
41.3 |
0.0 |
0.0 |
0.0 |
0.0 |
0.0 |
0.0 |
0.0 |
NA |
|
