| Seldovia
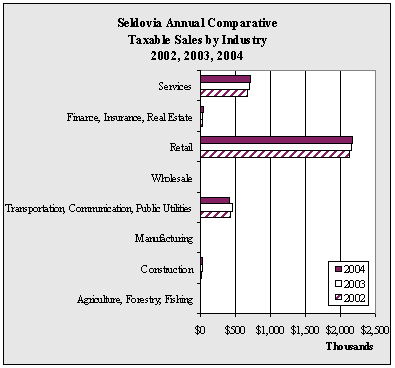
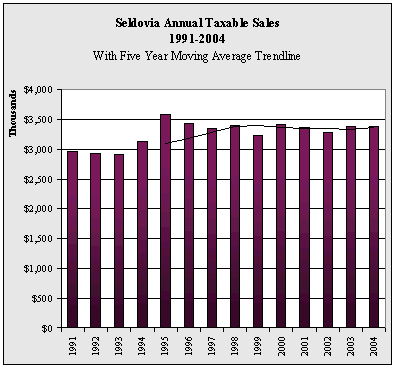
Annual Taxable Sales by Industry - 1998-2004 - in $ |
| |
1998 |
1999 |
2000 |
2001 |
2002 |
2003 |
2004 |
Annual
Change |
| Agriculture,
Forestry, Fishing |
3,422 |
3,084 |
2,771 |
3,616 |
3,551 |
2,970 |
3,140 |
5.7% |
| Construction |
32,244 |
37,757 |
41,098 |
34,175 |
22,683 |
26,848 |
27,088 |
0.9% |
| Manufacturing |
16,711 |
7,035 |
4,892 |
4,818 |
6,509 |
9,098 |
9,146 |
0.5% |
| Transportation,
Communication, Public Utilities |
438,292 |
473,005 |
455,499 |
410,584 |
427,667 |
450,291 |
411,317 |
-8.7% |
| Wholesale |
510,369 |
106,422 |
4,692 |
4,069 |
945 |
1,649 |
426 |
-74.2% |
| Retail |
1,577,816 |
1,877,036 |
2,165,560 |
2,226,879 |
2,118,927 |
2,155,556 |
2,167,989 |
0.6% |
| Finance,
Insurance, Real Estate |
83,118 |
65,347 |
28,771 |
31,657 |
24,937 |
29,796 |
43,310 |
45.4% |
| Services |
736,321 |
659,563 |
714,840 |
643,481 |
667,170 |
700,736 |
719,266 |
2.6% |
| Total |
3,398,293 |
3,229,249 |
3,418,123 |
3,359,279 |
3,272,389 |
3,376,944 |
3,381,682 |
0.1% |
| Annual
Change |
|
-5.0% |
5.8% |
-1.7% |
-2.6% |
3.2% |
0.1% |
|
|


