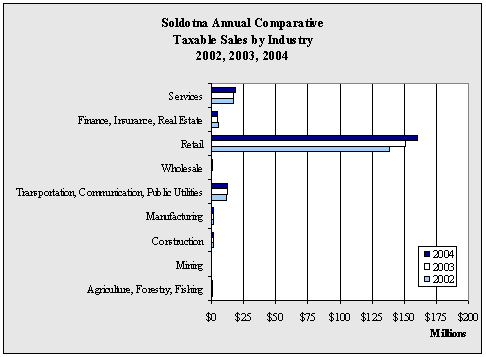
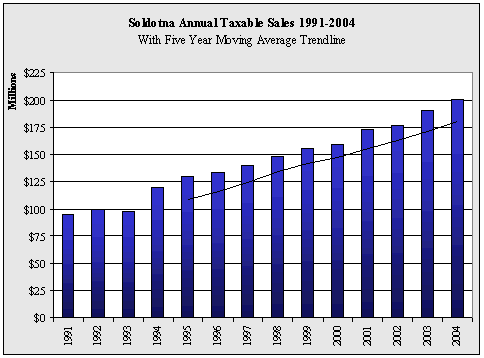
| Soldotna
Annual Taxable Sales by Industry - 1998-2004 - in $ |
| |
1998 |
1999 |
2000 |
2001 |
2002 |
2003 |
2004 |
Annual
Change |
| Agriculture,
Forestry, Fishing |
466,912 |
697,062 |
921,908 |
1,117,793 |
1,043,812 |
1,176,634 |
1,123,088 |
-4.6% |
| Mining |
8,010 |
5,675 |
11,333 |
35,080 |
33,278 |
33,067 |
20,326 |
-38.5% |
| Construction |
1,320,297 |
1,471,239 |
1,233,755 |
1,173,265 |
1,317,838 |
1,590,497 |
1,412,936 |
-11.2% |
| Manufacturing |
1,439,440 |
1,467,864 |
1,567,147 |
1,638,254 |
1,635,572 |
1,674,325 |
1,663,082 |
-0.7% |
| Transportation,
Communication, Public Utilities |
9,374,360 |
10,378,566 |
10,311,502 |
10,527,433 |
11,178,060 |
12,295,182 |
12,421,267 |
1.0% |
| Wholesale |
369,062 |
322,925 |
715,161 |
786,443 |
763,236 |
997,320 |
805,376 |
-19.2% |
| Retail |
115,732,671 |
122,401,180 |
124,618,575 |
136,194,643 |
138,178,507 |
151,168,576 |
159,827,563 |
5.7% |
| Finance,
Insurance, Real Estate |
3,662,452 |
3,776,435 |
4,545,775 |
5,207,613 |
5,279,203 |
4,435,121 |
4,396,348 |
-0.9% |
| Services |
15,398,236 |
15,403,419 |
15,493,910 |
15,718,811 |
17,525,783 |
17,204,443 |
18,359,304 |
6.7% |
| Government |
18,221 |
28,399 |
17,062 |
19,103 |
22,579 |
41,717 |
20,979 |
-49.7% |
| Total |
147,789,661 |
155,952,764 |
159,436,128 |
172,418,438 |
176,977,868 |
190,616,882 |
200,050,269 |
4.9% |
| Annual
Change |
|
5.5% |
2.2% |
8.1% |
2.6% |
7.7% |
4.9% |
|
|


