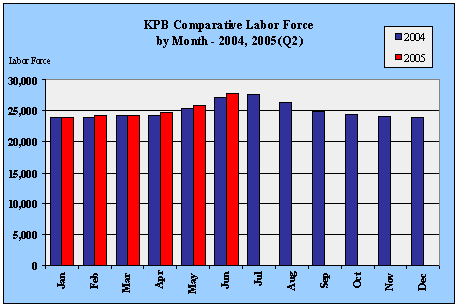
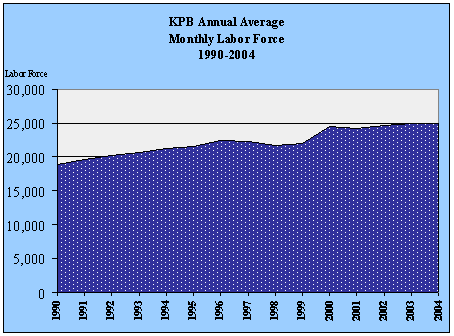
| KPB Labor
Force by Month - 1990-2005 |
| |
Jan |
Feb |
Mar |
Apr |
May |
Jun |
Jul |
Aug |
Sep |
Oct |
Nov |
Dec |
Avg |
| 1990 |
17,564 |
17,961 |
17,955 |
18,541 |
19,221 |
20,270 |
21,443 |
20,938 |
18,577 |
18,540 |
17,994 |
17,794 |
18,900 |
| 1991 |
18,381 |
18,683 |
18,701 |
19,243 |
19,674 |
20,785 |
22,469 |
21,530 |
19,892 |
19,111 |
18,966 |
18,699 |
19,678 |
| 1992 |
18,890 |
19,623 |
19,381 |
19,559 |
20,145 |
22,134 |
22,742 |
21,332 |
20,508 |
20,292 |
19,350 |
19,145 |
20,258 |
| 1993 |
18,480 |
19,492 |
19,749 |
19,900 |
20,254 |
22,689 |
24,023 |
22,948 |
20,520 |
20,560 |
19,705 |
19,339 |
20,638 |
| 1994 |
19,567 |
21,120 |
21,186 |
20,476 |
20,925 |
23,088 |
24,503 |
23,230 |
20,969 |
20,793 |
19,887 |
19,262 |
21,251 |
| 1995 |
20,592 |
21,194 |
20,910 |
20,449 |
20,994 |
22,646 |
24,230 |
23,407 |
21,538 |
21,337 |
20,292 |
19,807 |
21,450 |
| 1996 |
20,912 |
21,826 |
21,731 |
21,498 |
22,549 |
23,867 |
25,493 |
24,772 |
23,126 |
21,813 |
21,211 |
20,474 |
22,439 |
| 1997 |
21,692 |
22,407 |
21,900 |
21,940 |
21,929 |
24,014 |
25,338 |
24,296 |
22,369 |
21,180 |
20,448 |
19,878 |
22,283 |
| 1998 |
20,924 |
21,090 |
20,751 |
20,663 |
21,492 |
23,562 |
24,276 |
23,694 |
22,385 |
21,085 |
20,105 |
19,805 |
21,653 |
| 1999 |
20,653 |
21,359 |
21,279 |
21,368 |
21,936 |
23,579 |
24,619 |
23,921 |
22,572 |
21,575 |
20,663 |
20,119 |
21,970 |
| 2000 |
23,011 |
23,329 |
23,290 |
23,365 |
24,542 |
26,598 |
26,448 |
26,243 |
25,160 |
24,101 |
24,071 |
24,174 |
24,528 |
| 2001 |
23,056 |
23,003 |
23,055 |
23,139 |
24,195 |
26,114 |
26,836 |
25,619 |
24,496 |
23,717 |
23,656 |
23,801 |
24,224 |
| 2002 |
23,659 |
23,374 |
23,569 |
24,173 |
24,925 |
25,919 |
26,796 |
26,125 |
24,942 |
24,317 |
24,294 |
24,409 |
24,709 |
| 2003 |
24,298 |
24,108 |
24,243 |
24,379 |
25,394 |
26,781 |
27,170 |
26,352 |
24,571 |
24,028 |
23,988 |
23,875 |
24,932 |
| 2004 |
23,874 |
24,000 |
24,130 |
24,130 |
25,302 |
27,117 |
27,599 |
26,342 |
24,958 |
24,334 |
24,116 |
23,981 |
24,990 |
| 2005 |
23,873 |
24,220 |
24,295 |
24,749 |
25,830 |
27,751 |
|
|
|
|
|
|
|
|


