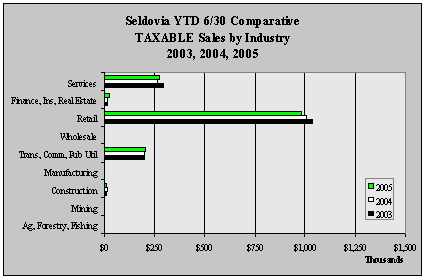
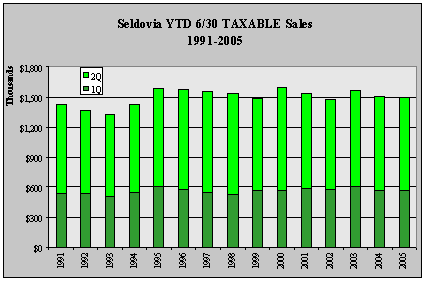
| Seldovia
YTD 6/30 TAXABLE Sales by Industry - 1999-2005 - in $ |
| |
1999 |
2000 |
2001 |
2002 |
2003 |
2004 |
2005 |
Annual
Change |
| Ag,
Forestry, Fishing |
2,605 |
2,771 |
3,616 |
3,551 |
2,970 |
3,140 |
0 |
-100.0% |
| Mining |
0 |
0 |
0 |
0 |
0 |
0 |
0 |
NA
|
| Construction |
13,925 |
21,043 |
17,093 |
16,110 |
11,077 |
13,218 |
9,770 |
-26.1% |
| Manufacturing |
3,556 |
2,576 |
2,297 |
3,000 |
2,117 |
2,784 |
3,650 |
31.1% |
| Trans,
Comm, Pub Util |
232,079 |
228,935 |
212,013 |
210,320 |
200,393 |
202,073 |
205,841 |
1.9% |
| Wholesale |
100,549 |
3,230 |
1,555 |
294 |
471 |
167 |
126 |
-24.6% |
| Retail |
818,999 |
1,001,378 |
1,049,195 |
957,765 |
1,035,907 |
1,005,601 |
981,335 |
-2.4% |
| Finance,
Ins, Real Estate |
35,132 |
17,589 |
13,823 |
13,322 |
14,030 |
14,482 |
21,944 |
51.5% |
| Services |
278,555 |
309,826 |
239,996 |
268,092 |
294,971 |
264,850 |
276,559 |
4.4% |
| Total |
1,485,400 |
1,587,348 |
1,539,588 |
1,472,454 |
1,561,936 |
1,506,315 |
1,499,225 |
-0.5% |
| Annual
Change |
|
6.9% |
-3.0% |
-4.4% |
6.1% |
-3.6% |
-0.5% |
|
|


