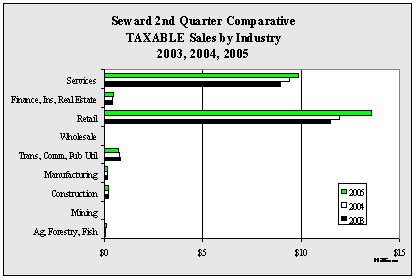
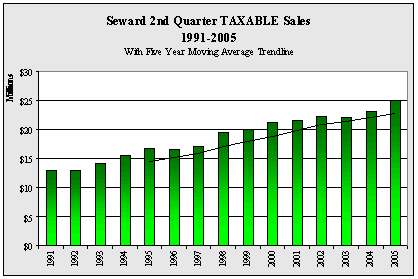
| Seward
2nd Quarter TAXABLE Sales by Industry - 1999-2005 - in $ |
| |
1999 |
2000 |
2001 |
2002 |
2003 |
2004 |
2005 |
Annual
Change |
| Ag,
Forestry, Fish |
65,022 |
79,544 |
69,770 |
57,747 |
70,505 |
77,870 |
87,792 |
12.7% |
| Mining |
0 |
500 |
0 |
0 |
1,754 |
0 |
0 |
NA
|
| Construction |
169,218 |
193,381 |
160,218 |
140,758 |
190,057 |
198,782 |
210,848 |
6.1% |
| Manufacturing |
163,167 |
177,059 |
312,269 |
299,221 |
157,138 |
162,634 |
133,934 |
-17.6% |
| Trans,
Comm, Pub Util |
959,392 |
1,115,553 |
795,756 |
780,744 |
806,530 |
758,614 |
702,890 |
-7.3% |
| Wholesale |
47,534 |
49,015 |
41,804 |
38,741 |
40,058 |
34,969 |
34,511 |
-1.3% |
| Retail |
9,619,860 |
10,592,090 |
10,866,501 |
11,179,774 |
11,465,828 |
11,956,679 |
13,567,363 |
13.5% |
| Finance,
Ins, Real Estate |
457,658 |
411,656 |
433,701 |
488,696 |
415,752 |
394,778 |
455,359 |
15.3% |
| Services |
8,425,335 |
8,542,100 |
8,873,245 |
9,190,793 |
8,924,459 |
9,412,719 |
9,847,255 |
4.6% |
| Total |
19,907,186 |
21,160,898 |
21,553,264 |
22,176,474 |
22,072,081 |
22,997,045 |
25,039,952 |
8.9% |
| Annual
Change |
|
6.3% |
1.9% |
2.9% |
-0.5% |
4.2% |
8.9% |
|
|


