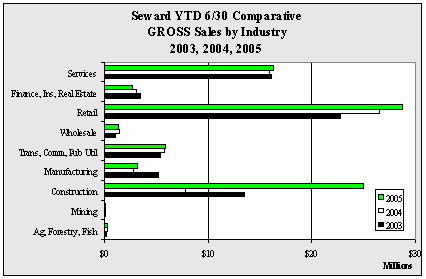
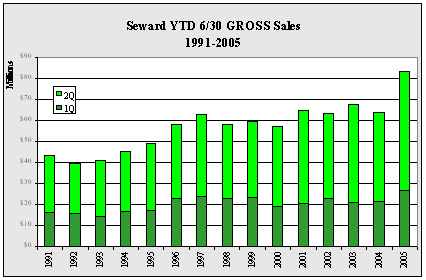
| Seward
YTD 6/30 GROSS Sales by Industry - 1999-2005 - in $ |
| |
1999 |
2000 |
2001 |
2002 |
2003 |
2004 |
2005 |
Annual
Change |
| Ag,
Forestry, Fish |
254,017 |
315,170 |
198,348 |
174,118 |
216,267 |
325,576 |
318,941 |
-2.0% |
| Mining |
172,680 |
246,904 |
169,292 |
180,102 |
117,510 |
103,785 |
100,192 |
-3.5% |
| Construction |
7,502,818 |
5,087,271 |
11,908,839 |
5,404,064 |
13,518,410 |
7,794,119 |
24,928,649 |
219.8% |
| Manufacturing |
2,309,328 |
2,902,160 |
6,012,064 |
5,235,668 |
5,253,891 |
2,814,701 |
3,211,905 |
14.1% |
| Trans,
Comm, Pub Util |
5,264,445 |
6,073,951 |
5,846,878 |
5,658,092 |
5,398,582 |
5,825,755 |
5,913,400 |
1.5% |
| Wholesale |
2,137,836 |
1,279,072 |
1,032,783 |
1,058,790 |
1,067,835 |
1,454,888 |
1,420,033 |
-2.4% |
| Retail |
20,749,276 |
22,501,067 |
22,110,814 |
23,242,276 |
22,775,722 |
26,568,352 |
28,725,311 |
8.1% |
| Finance,
Ins, Real Estate |
4,358,455 |
4,262,253 |
2,236,658 |
4,136,261 |
3,500,580 |
3,070,109 |
2,670,280 |
-13.0% |
| Services |
16,649,357 |
14,433,986 |
15,467,874 |
18,250,018 |
16,070,540 |
15,978,804 |
16,288,151 |
1.9% |
| Total |
59,398,212 |
57,101,834 |
64,983,550 |
63,339,389 |
67,919,337 |
63,936,089 |
83,576,862 |
30.7% |
| Annual
Change |
|
-3.9% |
13.8% |
-2.5% |
7.2% |
-5.9% |
30.7% |
|
|


