|
KPB 4th Quarter Gross Sales by Industry -
1997-2003 - in $
|
| |
1997 |
1998 |
1999 |
2000 |
2001 |
2002 |
2003 |
Annual
Change |
| Agriculture,
Forestry and Fishing |
5,488,460 |
3,867,526 |
2,415,584 |
1,405,543 |
1,943,526 |
2,053,010 |
2,050,076 |
-0.1% |
| Mining |
46,339,212 |
49,098,459 |
32,405,231 |
38,416,938 |
36,182,443 |
22,681,068 |
30,155,914 |
33.0% |
| Construction |
55,444,381 |
55,365,902 |
49,785,788 |
54,218,908 |
63,650,120 |
63,875,883 |
60,711,525 |
-5.0% |
| Manufacturing |
35,990,380 |
34,831,029 |
40,626,472 |
24,516,398 |
117,472,843 |
78,273,315 |
60,214,272 |
-23.1% |
| Transportation,
Communication, Public Utilities |
35,670,249 |
39,121,549 |
43,566,654 |
39,245,968 |
43,605,815 |
38,032,595 |
37,465,352 |
-1.5% |
| Wholesale |
36,140,860 |
35,312,940 |
37,307,418 |
37,534,503 |
40,753,611 |
47,369,703 |
46,261,864 |
-2.3% |
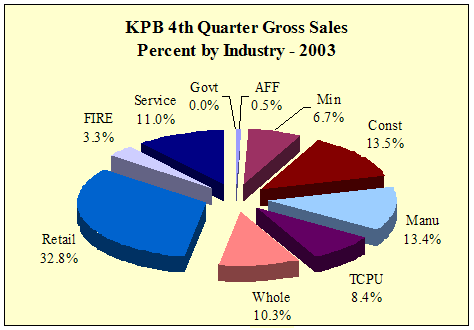
| Retail |
118,355,089 |
130,577,545 |
130,220,798 |
142,087,726 |
155,005,874 |
144,669,088 |
147,221,598 |
1.8% |
Finance,
Insurance,
Real Estate |
12,053,999 |
12,326,209 |
10,842,841 |
12,510,996 |
13,330,735 |
12,523,886 |
14,824,507 |
18.4% |
| Service |
40,286,913 |
38,492,406 |
38,778,926 |
43,574,842 |
48,056,385 |
46,284,529 |
49,370,454 |
6.7% |
| Government |
5,678 |
2,804 |
3,649 |
2,247 |
1,200 |
3,730 |
8,789 |
135.6% |
| Total |
397,211,078 |
432,932,104 |
401,490,353 |
393,514,069 |
520,002,552 |
455,766,807 |
448,284,351 |
-1.6% |
| Annual
Change |
|
9.0% |
-7.3% |
-2.0% |
32.1% |
-12.4% |
-1.6% |
|
|
KPB
4th Quarter Gross Sales Ten Year Change
by Industry - 1993-2003 - in $ |
| |
|
|
10
Year Change |
| |
1993 |
2003 |
Percentage |
Numerical |
| Agriculture,
Forestry and Fishing |
4,906,075 |
2,050,076 |
-58.2% |
-2,855,999 |
| Mining |
35,991,528 |
30,155,914 |
-16.2% |
-5,835,614 |
| Construction |
38,147,445 |
60,711,525 |
59.1% |
22,564,080 |
| Manufacturing |
25,220,741 |
60,214,272 |
138.7% |
34,993,531 |
| Transportation,
Communication, Public Utilities |
50,044,733 |
37,465,352 |
-25.1% |
-12,579,381 |
| Wholesale |
14,796,518 |
46,261,864 |
212.7% |
31,465,346 |
| Retail |
93,001,764 |
147,221,598 |
58.3% |
54,219,834 |
Finance,
Insurance,
Real Estate |
10,775,638 |
14,824,507 |
37.6% |
4,048,869 |
| Service |
29,030,700 |
49,370,454 |
70.1% |
20,339,754 |
| Government |
1,569 |
8,789 |
460.2% |
7,220 |
| Total |
324,878,306 |
448,284,351 |
38.0% |
123,406,045 |
|
KPB
4th Quarter Gross Sales One Year Change
by Industry - 2002-2003 - in $ |
| |
|
|
1
Year Change |
| |
2002 |
2003 |
Percentage |
Numerical |
| Agriculture,
Forestry and Fishing |
2,053,010 |
2,050,076 |
-0.1% |
-2,934 |
| Mining |
22,681,068 |
30,155,914 |
33.0% |
7,474,846 |
| Construction |
63,875,883 |
60,711,525 |
-5.0% |
-3,164,358 |
| Manufacturing |
78,273,315 |
60,214,272 |
-23.1% |
-18,059,043 |
| Transportation,
Communication, Public Utilities |
38,032,595 |
37,465,352 |
-1.5% |
-567,243 |
| Wholesale |
47,369,703 |
46,261,864 |
-2.3% |
-1,107,839 |
| Retail |
144,669,088 |
147,221,598 |
1.8% |
2,552,510 |
Finance,
Insurance,
Real Estate |
12,523,886 |
14,824,507 |
18.4% |
2,300,621 |
| Service |
46,284,529 |
49,370,454 |
6.7% |
3,085,925 |
| Government |
3,730 |
8,789 |
135.6% |
5,059 |
| Total |
455,766,807 |
448,284,351 |
-1.6% |
-7,482,456 |
|