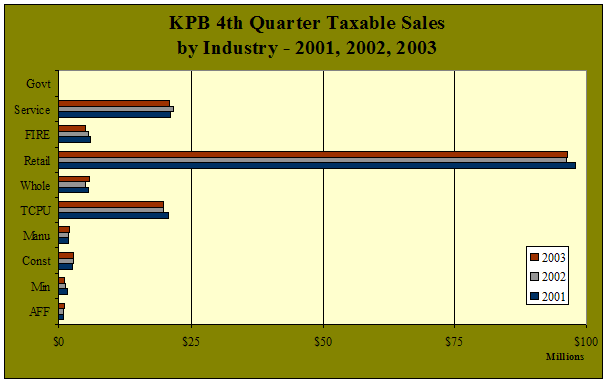
| KPB
4th Quarter Taxable Sales by Industry - 1997-2003 - in $ |
| |
1997 |
1998 |
1999 |
2000 |
2001 |
2002 |
2003 |
Annual
Change |
| Agriculture,
Forestry and Fishing |
658,405 |
755,627 |
720,599 |
858,593 |
822,040 |
840,876 |
955,930 |
13.7% |
| Mining |
1,525,849 |
1,043,377 |
1,097,822 |
1,260,660 |
1,609,419 |
1,331,469 |
1,153,962 |
-13.3% |
| Construction |
2,198,539 |
2,606,387 |
2,564,023 |
2,389,832 |
2,556,351 |
2,703,782 |
2,670,633 |
-1.2% |
| Manufacturing |
1,785,181 |
1,840,127 |
1,914,558 |
1,986,299 |
1,768,274 |
1,800,030 |
1,847,529 |
2.6% |
| Transportation,
Communication, Public Utilities |
17,281,474 |
17,906,374 |
21,604,603 |
18,998,539 |
20,694,360 |
19,815,690 |
19,789,503 |
-0.1% |
| Wholesale |
4,915,376 |
4,426,560 |
5,147,173 |
5,136,269 |
5,558,317 |
4,911,676 |
5,741,544 |
16.9% |
| Retail |
81,140,024 |
84,978,995 |
88,028,006 |
91,805,251 |
97,952,968 |
96,166,333 |
96,489,021 |
0.3% |
Finance,
Insurance,
Real Estate |
4,389,506 |
4,464,490 |
4,277,556 |
5,294,817 |
5,859,794 |
5,621,031 |
4,929,505 |
-12.3% |
| Service |
20,523,076 |
19,482,050 |
19,633,084 |
21,298,219 |
21,165,145 |
21,602,268 |
21,095,302 |
-2.3% |
| Government |
5,671 |
2,797 |
3,649 |
2,247 |
1,200 |
3,730 |
8,789 |
135.6% |
| Total |
134,423,101 |
137,506,784 |
144,991,073 |
149,030,726 |
157,987,868 |
154,796,885 |
154,681,718 |
-0.1% |
| Annual
Change |
|
2.3% |
5.4% |
2.8% |
6.0% |
-2.0% |
-0.1% |
|
|
KPB
4th Quarter Taxable Sales Ten Year Change
by Industry - 1993-2003 - in $ |
| |
|
|
10
Year Change |
| |
1993 |
2003 |
Percentage |
Numerical |
| Agriculture,
Forestry and Fishing |
512,474 |
955,930 |
86.5% |
443,456 |
| Mining |
2,056,838 |
1,153,962 |
-43.9% |
-902,876 |
| Construction |
2,016,222 |
2,670,633 |
32.5% |
654,411 |
| Manufacturing |
1,482,607 |
1,847,529 |
24.6% |
364,922 |
| Transportation,
Communication, Public Utilities |
14,622,565 |
19,789,503 |
35.3% |
5,166,938 |
| Wholesale |
4,237,743 |
5,741,544 |
35.5% |
1,503,801 |
| Retail |
68,634,073 |
96,489,021 |
40.6% |
27,854,948 |
Finance,
Insurance,
Real Estate |
4,372,604 |
4,929,505 |
12.7% |
556,901 |
| Service |
15,758,744 |
21,095,302 |
33.9% |
5,336,558 |
| Government |
1,569 |
8,789 |
460.2% |
7,220 |
| Total |
113,695,439 |
154,681,718 |
36.0% |
40,986,279 |
|
KPB
4th Quarter Taxable Sales One Year Change
by Industry - 2002-2003 - in $ |
| |
|
|
1
Year Change |
| |
2002 |
2003 |
Percentage |
Numerical |
| Agriculture,
Forestry and Fishing |
840,876 |
955,930 |
13.7% |
115,054 |
| Mining |
1,331,469 |
1,153,962 |
-13.3% |
-177,507 |
| Construction |
2,703,782 |
2,670,633 |
-1.2% |
-33,149 |
| Manufacturing |
1,800,030 |
1,847,529 |
2.6% |
47,499 |
| Transportation,
Communication, Public Utilities |
19,815,690 |
19,789,503 |
-0.1% |
-26,187 |
| Wholesale |
4,911,676 |
5,741,544 |
16.9% |
829,868 |
| Retail |
96,166,333 |
96,489,021 |
0.3% |
322,688 |
Finance,
Insurance,
Real Estate |
5,621,031 |
4,929,505 |
-12.3% |
-691,526 |
| Service |
21,602,268 |
21,095,302 |
-2.3% |
-506,966 |
| Government |
3,730 |
8,789 |
135.6% |
5,059 |
| Total |
154,796,885 |
154,681,718 |
-0.1% |
-115,167 |
|


