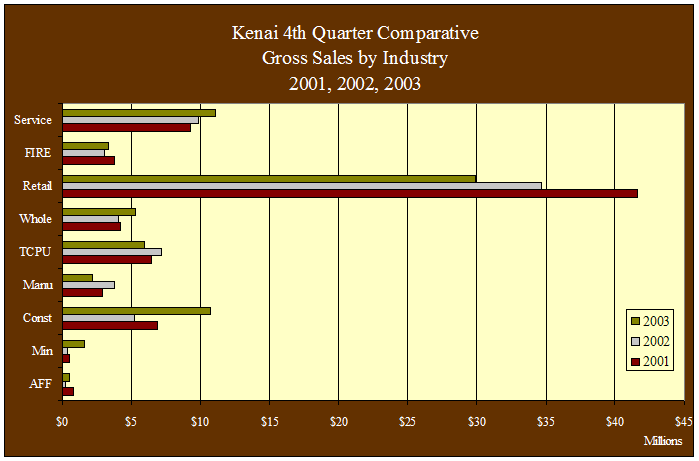
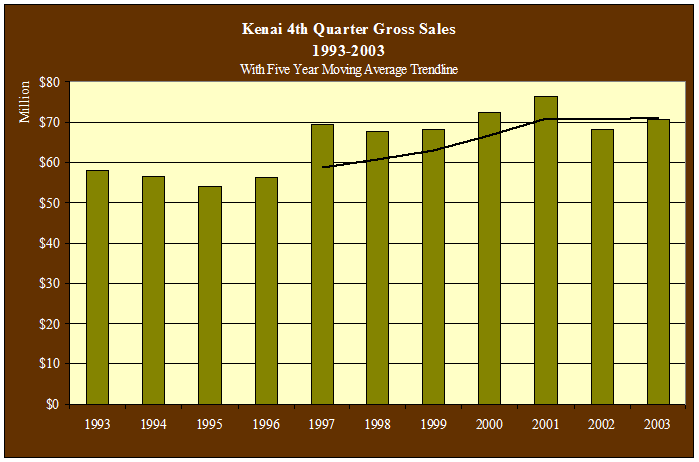
| Kenai
4th Quarter Gross Sales by Industry - 1997-2003 - in $ |
| |
1997 |
1998 |
1999 |
2000 |
2001 |
2002 |
2003 |
Annual
Change |
| AFF |
4,197,821 |
2,414,459 |
1,208,946 |
147,395 |
825,507 |
227,354 |
459,454 |
102.1% |
| Min |
76,872 |
21,156 |
911,206 |
1,357,532 |
520,572 |
379,608 |
1,583,457 |
317.1% |
| Const |
5,943,060 |
5,761,348 |
7,663,858 |
4,782,252 |
6,858,111 |
5,187,608 |
10,685,383 |
106.0% |
| Manu |
9,506,002 |
1,826,500 |
2,053,148 |
2,807,139 |
2,894,059 |
3,767,980 |
2,219,637 |
-41.1% |
| TCPU |
5,608,030 |
5,893,200 |
8,441,455 |
6,053,715 |
6,424,086 |
7,157,805 |
5,911,234 |
-17.4% |
| Whole |
2,595,412 |
2,383,031 |
2,774,886 |
5,106,481 |
4,233,797 |
4,069,622 |
5,315,901 |
30.6% |
| Retail |
29,600,210 |
38,027,088 |
34,505,929 |
40,741,748 |
41,619,799 |
34,632,442 |
29,906,738 |
-13.6% |
| FIRE |
2,327,898 |
2,571,040 |
2,586,301 |
3,355,291 |
3,810,903 |
3,049,232 |
3,324,463 |
9.0% |
| Service |
9,644,451 |
8,711,175 |
7,804,528 |
8,057,174 |
9,229,709 |
9,836,852 |
11,084,753 |
12.7% |
| Total |
69,499,878 |
67,609,090 |
67,950,329 |
72,408,759 |
76,416,543 |
68,308,503 |
70,491,020 |
3.2% |
| Annual
Change |
|
-2.7% |
0.5% |
6.6% |
5.5% |
-10.6% |
3.2% |
|
|


