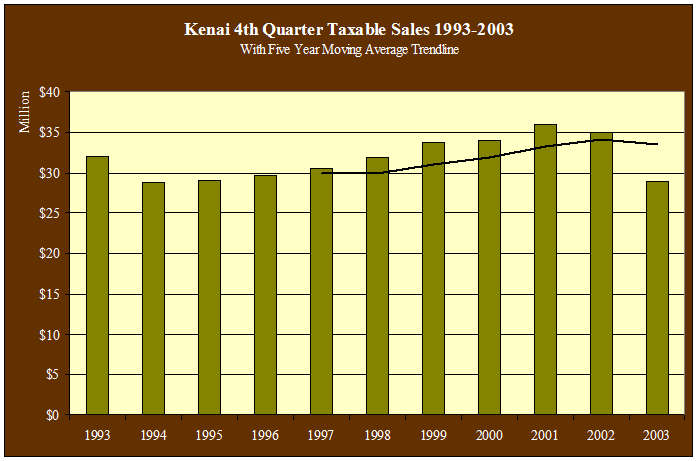
| Kenai
4th Quarter Taxable Sales by Industry - 1997-2003 - in $ |
| |
1997 |
1998 |
1999 |
2000 |
2001 |
2002 |
2003 |
Annual
Change |
| AFF |
80,785 |
93,304 |
91,253 |
89,000 |
100,269 |
86,211 |
97,896 |
13.6% |
| Min |
4,236 |
8,764 |
40,690 |
46,005 |
41,886 |
52,224 |
60,465 |
15.8% |
| Const |
308,767 |
328,236 |
323,173 |
287,662 |
354,826 |
295,015 |
306,419 |
3.9% |
| Manu |
419,575 |
394,728 |
442,960 |
552,715 |
414,560 |
491,314 |
496,859 |
1.1% |
| TCPU |
3,197,255 |
3,327,590 |
5,377,374 |
3,271,246 |
3,498,645 |
4,335,310 |
3,694,449 |
-14.8% |
| Whole |
242,852 |
217,893 |
217,551 |
203,256 |
153,504 |
123,316 |
180,530 |
46.4% |
| Retail |
21,242,523 |
22,614,704 |
22,296,352 |
23,950,857 |
25,525,358 |
23,980,314 |
18,564,688 |
-22.6% |
| FIRE |
1,182,579 |
1,213,222 |
1,146,639 |
1,615,987 |
1,768,098 |
1,564,165 |
1,230,983 |
-21.3% |
| Service |
3,787,180 |
3,758,639 |
3,781,751 |
4,045,585 |
4,140,044 |
4,058,716 |
4,253,078 |
4.8% |
| Total |
30,465,867 |
31,957,166 |
33,717,815 |
34,062,345 |
35,997,190 |
34,986,585 |
28,885,367 |
-17.4% |
| Annual
Change |
|
4.9% |
5.5% |
1.0% |
5.7% |
-2.8% |
-17.4% |
|
|


