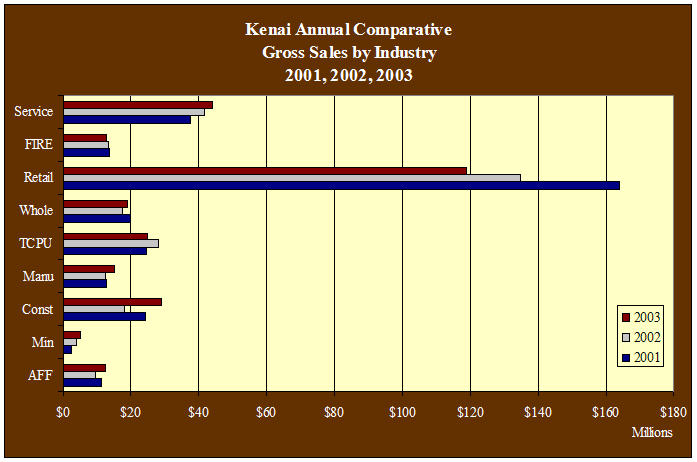
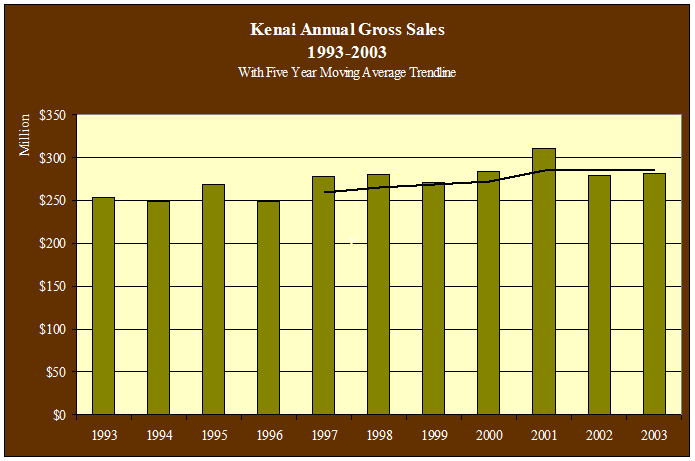
| Kenai
Annual Gross Sales by Industry - 1997-2003 - in $ |
| |
1997 |
1998 |
1999 |
2000 |
2001 |
2002 |
2003 |
Annual
Change |
| AFF |
39,508,868 |
21,856,770 |
27,031,481 |
17,757,626 |
11,304,090 |
9,488,174 |
12,573,514 |
32.5% |
| Min |
87,898 |
208,531 |
1,424,691 |
5,507,130 |
2,507,234 |
3,916,074 |
4,915,930 |
25.5% |
| Const |
18,090,949 |
21,481,466 |
20,692,714 |
17,177,398 |
24,150,985 |
17,879,471 |
29,017,296 |
62.3% |
| Manu |
20,729,358 |
7,526,545 |
7,854,159 |
10,445,806 |
12,646,047 |
12,496,147 |
14,956,480 |
19.7% |
| TCPU |
21,416,815 |
23,017,785 |
26,815,943 |
24,139,348 |
24,456,189 |
28,014,999 |
24,857,897 |
-11.3% |
| Whole |
11,356,889 |
10,194,981 |
10,520,958 |
17,902,155 |
19,991,594 |
17,521,629 |
19,019,180 |
8.5% |
| Retail |
122,652,552 |
149,397,570 |
133,272,201 |
145,306,370 |
164,047,542 |
134,906,917 |
118,935,906 |
-11.8% |
| FIRE |
10,215,283 |
10,300,066 |
10,463,600 |
11,935,000 |
13,853,920 |
13,529,801 |
12,734,697 |
-5.9% |
| Service |
34,033,796 |
36,094,281 |
32,669,956 |
33,511,343 |
37,469,061 |
41,671,134 |
43,993,711 |
5.6% |
| Total |
278,096,377 |
280,079,940 |
270,746,118 |
283,682,464 |
310,427,875 |
279,424,346 |
281,004,611 |
0.6% |
| Annual
Change |
|
0.7% |
-3.3% |
4.8% |
9.4% |
-10.0% |
0.6% |
|
|


