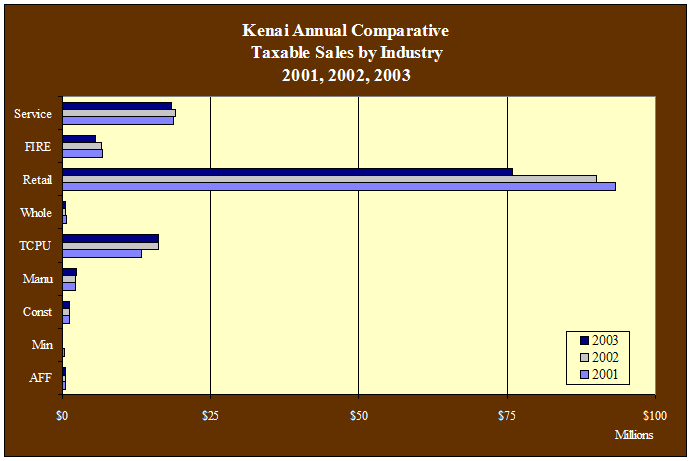
| Kenai
Annual Taxable Sales by Industry - 1997-2006 - in $ |
| |
1997 |
1998 |
1999 |
2000 |
2001 |
2002 |
2003 |
Annual
Change |
| AFF |
516,660 |
448,689 |
513,026 |
518,603 |
505,615 |
505,614 |
557,917 |
10.3% |
| Min |
10,263 |
49,522 |
96,651 |
166,846 |
223,196 |
213,971 |
192,718 |
-9.9% |
| Const |
1,135,092 |
1,200,303 |
1,180,607 |
1,085,964 |
1,170,924 |
1,107,601 |
1,158,587 |
4.6% |
| Manu |
2,273,850 |
2,140,912 |
2,085,657 |
2,450,721 |
2,238,645 |
2,218,515 |
2,442,369 |
10.1% |
| TCPU |
12,833,057 |
12,899,378 |
15,330,911 |
13,659,199 |
13,454,557 |
16,314,687 |
16,126,523 |
-1.2% |
| Whole |
956,665 |
877,088 |
829,682 |
898,759 |
753,765 |
517,025 |
589,480 |
14.0% |
| Retail |
78,793,974 |
80,814,442 |
81,828,974 |
85,347,467 |
93,227,651 |
90,074,697 |
76,037,947 |
-15.6% |
| FIRE |
4,895,151 |
4,918,254 |
4,824,067 |
5,718,387 |
6,757,340 |
6,600,246 |
5,559,581 |
-15.8% |
| Service |
17,158,080 |
16,680,181 |
17,677,101 |
17,919,892 |
18,713,143 |
19,077,340 |
18,490,088 |
-3.1% |
| Total |
118,576,754 |
120,030,707 |
124,367,091 |
127,766,126 |
137,046,049 |
136,629,696 |
121,155,210 |
-11.3% |
| Annual
Change |
|
1.2% |
3.6% |
2.7% |
7.3% |
-0.3% |
-11.3% |
|
|