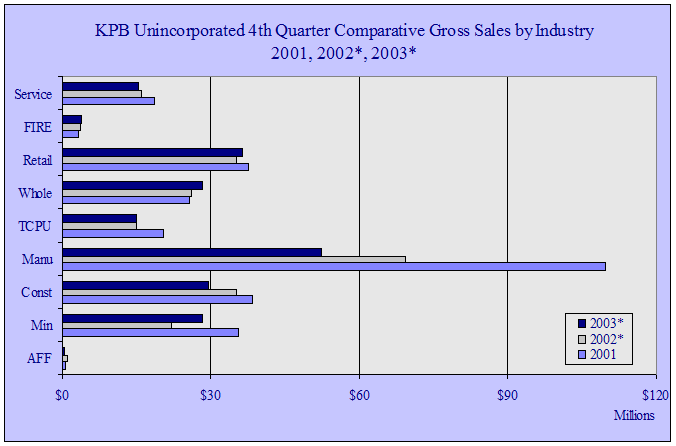
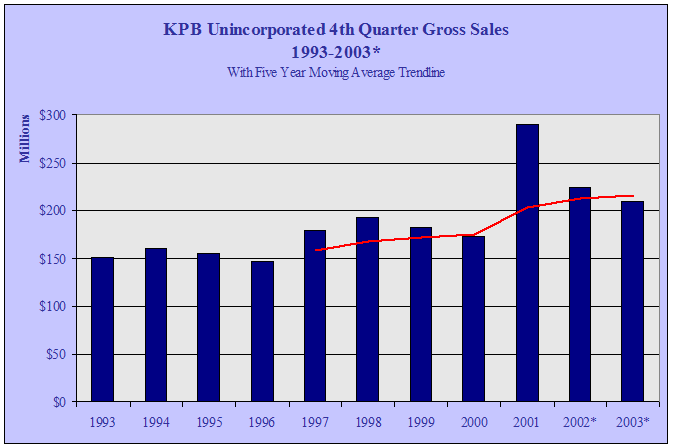
| KPB
Unincorporated 4th Quarter Gross Sales by Industry - 1997-2003 - in
$ |
| |
1997 |
1998 |
1999 |
2000 |
2001 |
2002* |
2003* |
Annual
Change |
| AFF |
942,816 |
954,784 |
487,509 |
598,868 |
609,830 |
1,070,350 |
594,227 |
-44.5% |
| Min |
45,899,968 |
47,910,745 |
31,346,369 |
36,917,017 |
35,575,897 |
22,118,005 |
28,430,406 |
28.5% |
| Const |
24,979,114 |
28,821,474 |
25,024,193 |
25,829,999 |
38,440,735 |
35,329,878 |
29,468,106 |
-16.6% |
| Manu |
20,449,834 |
26,647,655 |
34,645,835 |
16,081,645 |
109,743,267 |
69,309,105 |
52,344,082 |
-24.5% |
| TCPU |
16,412,738 |
18,207,994 |
20,201,622 |
17,957,230 |
20,376,126 |
14,919,023 |
14,958,018 |
0.3% |
| Whole |
25,691,955 |
23,358,913 |
23,270,604 |
23,543,846 |
25,720,598 |
26,044,742 |
28,213,523 |
8.3% |
| Retail |
28,445,320 |
29,811,129 |
30,507,754 |
31,112,790 |
37,657,463 |
35,323,103 |
36,517,483 |
3.4% |
| FIRE |
4,237,797 |
3,967,408 |
2,701,521 |
3,083,532 |
3,230,442 |
3,622,620 |
3,842,229 |
6.1% |
| Service |
12,957,982 |
13,411,428 |
14,084,496 |
17,062,864 |
18,677,031 |
15,998,545 |
15,419,183 |
-3.6% |
| Total |
180,020,471 |
193,091,815 |
182,269,903 |
172,187,791 |
290,031,389 |
223,735,371 |
209,787,257 |
-6.2% |
| Annual
Change |
|
7.3% |
-5.6% |
-5.5% |
68.4% |
-22.9% |
-6.2% |
|
|


