| KPB
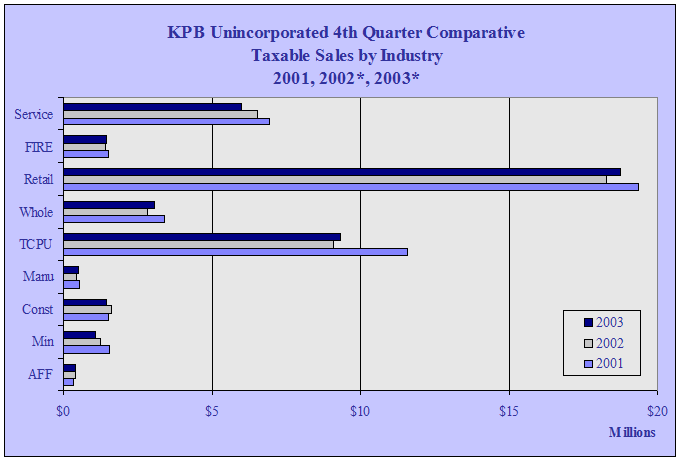
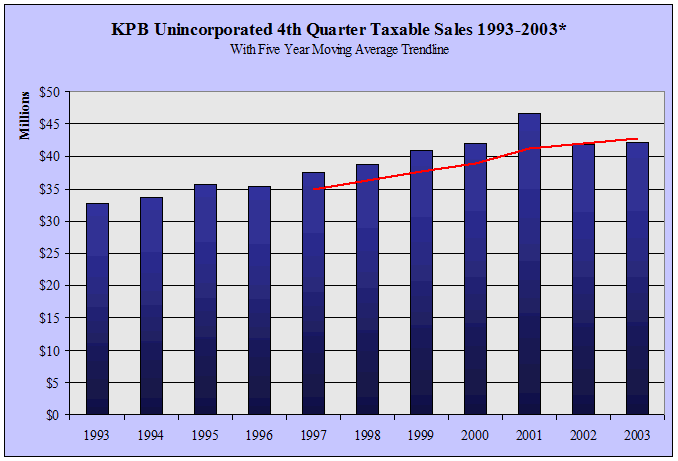
Unincorporated 4th Quarter Taxable Sales by Industry - 1997-2003 -
in $ |
| |
1997 |
1998 |
1999 |
2000 |
2001 |
2002 |
2003 |
Annual
Change |
| AFF |
341,912 |
320,559 |
317,244 |
427,648 |
354,923 |
404,614 |
423,149 |
4.6% |
| Min |
1,518,962 |
1,032,762 |
1,055,672 |
1,212,813 |
1,558,640 |
1,267,664 |
1,085,402 |
-14.4% |
| Const |
1,199,697 |
1,516,259 |
1,437,474 |
1,427,416 |
1,516,276 |
1,635,240 |
1,463,398 |
-10.5% |
| Manu |
512,336 |
580,152 |
589,398 |
521,819 |
544,363 |
464,417 |
503,232 |
8.4% |
| TCPU |
8,850,204 |
9,157,762 |
10,261,420 |
10,174,859 |
11,558,896 |
9,076,753 |
9,318,255 |
2.7% |
| Whole |
2,648,211 |
2,374,713 |
2,983,283 |
3,015,555 |
3,424,874 |
2,858,282 |
3,086,890 |
8.0% |
| Retail |
15,513,314 |
16,269,944 |
17,242,257 |
17,199,221 |
19,348,344 |
18,286,748 |
18,747,891 |
2.5% |
| FIRE |
1,337,734 |
1,296,652 |
1,200,176 |
1,300,311 |
1,500,322 |
1,423,071 |
1,450,667 |
1.9% |
| Service |
5,600,343 |
6,224,248 |
5,898,827 |
6,688,295 |
6,932,847 |
6,521,243 |
6,006,886 |
-7.9% |
| Total |
37,525,660 |
38,773,336 |
40,985,751 |
41,967,937 |
46,739,485 |
41,938,032 |
42,085,770 |
0.4% |
| Annual
Change |
|
3.3% |
5.7% |
2.4% |
11.4% |
-10.3% |
0.4% |
|
|


