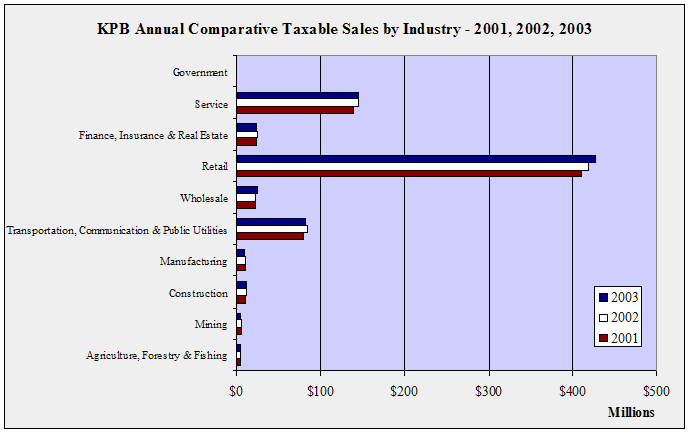
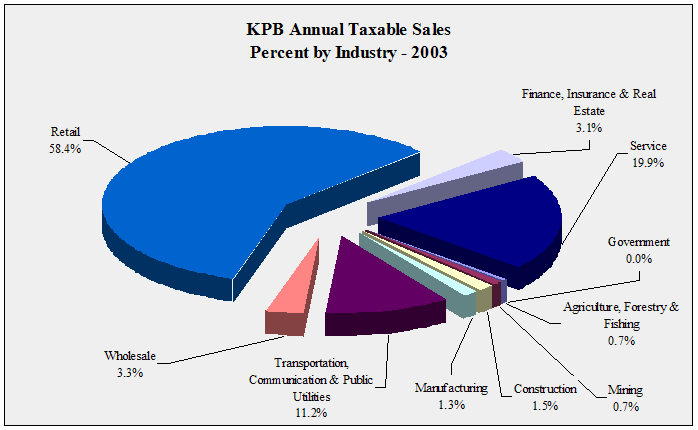
| KPB
Annual Taxable Sales by Industry - 1997-2003 - in $ |
| |
1997 |
1998 |
1999 |
2000 |
2001 |
2002 |
2003 |
Annual
Change |
| Agriculture,
Forestry & Fishing |
3,354,906 |
3,458,989 |
3,539,802 |
4,148,862 |
4,390,790 |
4,461,252 |
5,010,961 |
12.3% |
| Mining |
5,109,284 |
5,202,698 |
3,828,650 |
4,613,878 |
5,863,223 |
5,848,904 |
4,885,262 |
-16.5% |
| Construction |
8,746,301 |
9,821,330 |
9,921,434 |
9,648,292 |
9,995,849 |
10,688,986 |
11,263,152 |
5.4% |
| Manufacturing |
9,258,454 |
9,578,020 |
9,251,298 |
9,792,611 |
9,654,663 |
9,616,559 |
9,235,045 |
-4.0% |
| Transportation,
Communication & Public Utilities |
69,494,931 |
72,108,745 |
79,282,344 |
77,620,518 |
79,669,176 |
84,109,999 |
81,675,950 |
-2.9% |
| Wholesale |
20,313,425 |
18,357,305 |
19,290,256 |
21,493,691 |
22,308,044 |
21,690,782 |
24,139,455 |
11.3% |
| Retail |
339,027,380 |
353,131,302 |
367,123,730 |
382,738,961 |
410,495,194 |
418,295,651 |
427,778,523 |
2.3% |
| Finance,
Insurance & Real Estate |
18,489,067 |
18,576,711 |
18,862,816 |
20,689,601 |
23,466,772 |
24,064,427 |
22,717,932 |
-5.6% |
| Service |
116,685,824 |
122,225,757 |
129,434,976 |
136,236,408 |
139,391,133 |
145,028,441 |
145,392,805 |
0.3% |
| Government |
45,238 |
26,744 |
28,814 |
17,350 |
20,316 |
22,579 |
41,980 |
85.9% |
| Total |
590,524,810 |
612,487,601 |
640,564,120 |
667,000,172 |
705,255,160 |
723,827,580 |
732,141,065 |
1.1% |
| Annual
Change |
|
3.7% |
4.6% |
4.1% |
5.7% |
2.6% |
1.1% |
|
|
KPB
Annual Taxable Sales Ten Year Change
by Industry
1993-2003 - in $ |
| |
|
|
10
Year Change |
| |
1993 |
2003 |
Percentage |
Numerical |
| Agriculture,
Forestry & Fishing |
3,565,282 |
5,010,961 |
40.5% |
1,445,679 |
| Mining |
7,547,231 |
4,885,262 |
-35.3% |
-2,661,969 |
| Construction |
7,579,704 |
11,263,152 |
48.6% |
3,683,448 |
| Manufacturing |
7,125,238 |
9,235,045 |
29.6% |
2,109,807 |
| Transportation,
Communication & Public Utilities |
59,191,931 |
81,675,950 |
38.0% |
22,484,019 |
| Wholesale |
17,462,571 |
24,139,455 |
38.2% |
6,676,884 |
| Retail |
281,028,087 |
427,778,523 |
52.2% |
146,750,436 |
| Finance,
Insurance & Real Estate |
17,516,227 |
22,717,932 |
29.7% |
5,201,705 |
| Service |
91,261,264 |
145,392,805 |
59.3% |
54,131,541 |
| Government |
7,670 |
41,980 |
447.3% |
34,310 |
| Total |
492,285,205 |
732,141,065 |
48.7% |
239,855,860 |
|
KPB
Annual Taxable Sales One Year Change
by Industry
2002-2003 - in $ |
| |
|
|
1
Year Change |
| |
2002 |
2003 |
Percentage |
Numerical |
| Agriculture,
Forestry & Fishing |
4,461,252 |
5,010,961 |
12.3% |
549,709 |
| Mining |
5,848,904 |
4,885,262 |
-16.5% |
-963,642 |
| Construction |
10,688,986 |
11,263,152 |
5.4% |
574,166 |
| Manufacturing |
9,616,559 |
9,235,045 |
-4.0% |
-381,514 |
| Transportation,
Communication & Public Utilities |
84,109,999 |
81,675,950 |
-2.9% |
-2,434,049 |
| Wholesale |
21,690,782 |
24,139,455 |
11.3% |
2,448,673 |
| Retail |
418,295,651 |
427,778,523 |
2.3% |
9,482,872 |
| Finance,
Insurance & Real Estate |
24,064,427 |
22,717,932 |
-5.6% |
-1,346,495 |
| Service |
145,028,441 |
145,392,805 |
0.3% |
364,364 |
| Government |
22,579 |
41,980 |
85.9% |
19,401 |
| Total |
723,827,580 |
732,141,065 |
1.1% |
8,313,485 |
|
 |
 |
|