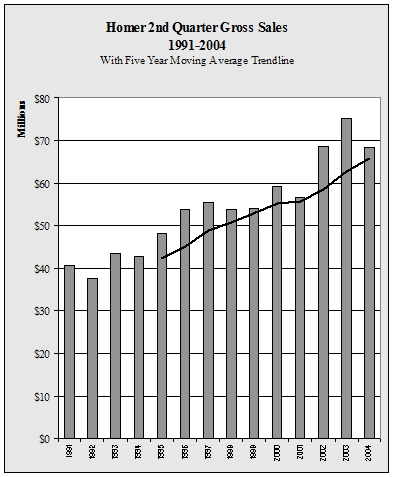
| Homer
2nd Quarter Gross Sales by Industry - 1998-2004 - in $ |
| |
1998 |
1999 |
2000 |
2001 |
2002 |
2003 |
2004 |
Annual
Change |
| AFF |
358,816 |
297,282 |
615,776 |
221,357 |
250,389 |
420,146 |
430,095 |
2.4% |
| Min |
0 |
0 |
0 |
1,844 |
3,836 |
0 |
0 |
NA |
| Const |
7,282,006 |
5,877,294 |
11,808,767 |
6,727,125 |
7,437,731 |
11,063,631 |
5,676,804 |
-48.7% |
| Manu |
3,713,962 |
4,737,214 |
1,939,037 |
1,455,193 |
1,790,421 |
1,899,935 |
1,658,400 |
-12.7% |
| TCPU |
8,440,642 |
8,239,713 |
8,584,067 |
8,926,617 |
10,982,097 |
9,778,534 |
4,978,770 |
-49.1% |
| Whole |
4,265,033 |
4,606,377 |
4,452,048 |
5,204,028 |
5,360,132 |
6,092,813 |
6,421,683 |
5.4% |
| Retail |
18,131,184 |
18,330,887 |
19,883,252 |
20,971,844 |
24,984,603 |
27,535,917 |
29,778,375 |
8.1% |
| FIRE |
2,283,604 |
1,917,870 |
1,682,104 |
1,977,911 |
2,046,589 |
2,547,587 |
2,357,634 |
-7.5% |
| Service |
9,227,118 |
9,864,551 |
10,274,231 |
11,241,457 |
15,720,106 |
15,802,725 |
16,879,672 |
6.8% |
| Total |
53,702,365 |
53,871,188 |
59,239,282 |
56,727,376 |
68,575,904 |
75,141,288 |
68,181,433 |
-9.3% |
| Annual
Change |
|
0.3% |
10.0% |
-4.2% |
20.9% |
9.6% |
-9.3% |
|
|


