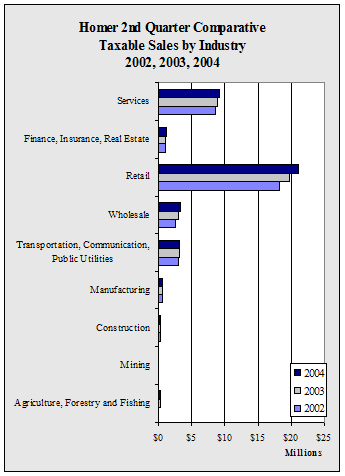
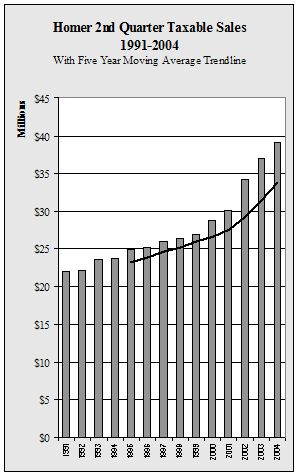
| Homer
2nd Quarter Taxable Sales by Industry - 1998-2004 - in $ |
| |
1998 |
1999 |
2000 |
2001 |
2002 |
2003 |
2004 |
Annual
Change |
| Agriculture,
Forestry and Fishing |
189,548 |
119,513 |
134,398 |
146,035 |
166,982 |
212,539 |
247,630 |
16.5% |
| Mining |
0 |
0 |
0 |
1,549 |
1,955 |
0 |
0 |
NA
|
| Construction |
186,226 |
243,633 |
223,397 |
217,384 |
266,994 |
308,150 |
317,725 |
3.1% |
| Manufacturing |
558,261 |
629,296 |
605,159 |
528,377 |
557,095 |
532,466 |
587,617 |
10.4% |
| Transportation,
Communication, Public Utilities |
2,465,122 |
2,572,659 |
2,607,929 |
2,581,062 |
2,873,043 |
3,212,975 |
3,236,516 |
0.7% |
| Wholesale |
2,072,798 |
2,136,082 |
2,427,493 |
2,538,512 |
2,518,226 |
2,966,252 |
3,320,782 |
12.0% |
| Retail |
13,676,787 |
13,815,206 |
14,899,354 |
15,857,949 |
18,243,103 |
19,759,521 |
21,076,002 |
6.7% |
| Finance,
Insurance, Real Estate |
727,450 |
751,660 |
811,036 |
920,819 |
1,005,737 |
1,062,452 |
1,089,142 |
2.5% |
| Services |
6,489,905 |
6,670,510 |
7,043,956 |
7,323,779 |
8,571,580 |
8,890,648 |
9,217,830 |
3.7% |
| Total |
26,366,097 |
26,938,559 |
28,752,722 |
30,115,466 |
34,204,715 |
36,945,003 |
39,093,244 |
5.8% |
| Annual
Change |
|
2.2% |
6.7% |
4.7% |
13.6% |
8.0% |
5.8% |
|
|


