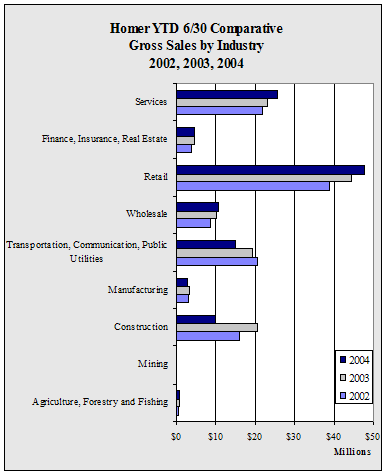
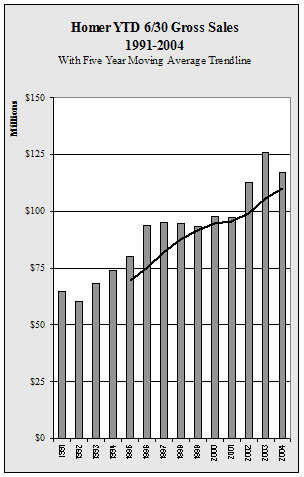
| Homer
YTD 6/30 Gross Sales by Industry - 1998-2004 - in $ |
| |
1998 |
1999 |
2000 |
2001 |
2002 |
2003 |
2004 |
Annual
Change |
| Agriculture,
Forestry and Fishing |
453,498 |
391,347 |
790,276 |
381,823 |
385,101 |
669,479 |
659,447 |
-1.5% |
| Mining |
0 |
195 |
0 |
10,981 |
5,199 |
0 |
256 |
NA
|
| Construction |
13,536,428 |
11,889,063 |
19,103,934 |
14,850,565 |
15,868,655 |
20,492,336 |
9,999,169 |
-51.2% |
| Manufacturing |
10,095,704 |
8,247,806 |
3,692,870 |
2,780,586 |
3,044,255 |
3,217,571 |
2,765,756 |
-14.0% |
| Transportation,
Communication, Public Utilities |
16,699,047 |
16,553,120 |
16,347,045 |
17,319,824 |
20,766,385 |
19,239,191 |
14,956,164 |
-22.3% |
| Wholesale |
6,817,991 |
8,743,545 |
7,629,651 |
8,704,682 |
8,718,142 |
10,137,408 |
10,543,855 |
4.0% |
| Retail |
29,495,963 |
29,615,149 |
32,088,649 |
33,897,868 |
38,751,023 |
44,628,232 |
47,911,802 |
7.4% |
| Finance,
Insurance, Real Estate |
4,132,918 |
3,874,889 |
3,129,665 |
3,379,438 |
3,574,314 |
4,537,512 |
4,602,570 |
1.4% |
| Services |
13,525,300 |
14,109,722 |
14,906,209 |
16,240,697 |
21,722,565 |
23,051,332 |
25,646,004 |
11.3% |
| Total |
94,756,849 |
93,424,836 |
97,688,299 |
97,566,464 |
112,835,639 |
125,973,061 |
117,085,023 |
-7.1% |
| Annual
Change |
|
-1.4% |
4.6% |
-0.1% |
15.7% |
11.6% |
-7.1% |
|
|


