| Homer
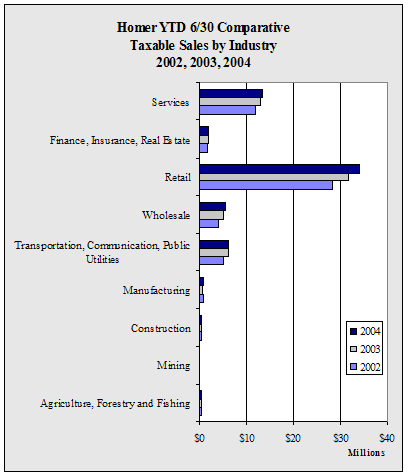
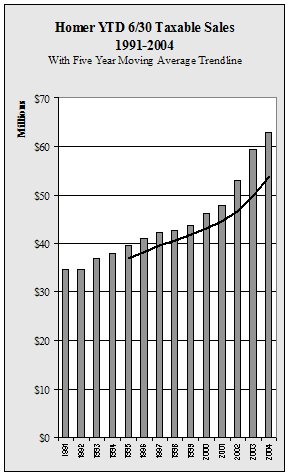
YTD 6/30 Taxable Sales by Industry - 1998-2004 - in $ |
| |
1998 |
1999 |
2000 |
2001 |
2002 |
2003 |
2004 |
Annual
Change |
| Agriculture,
Forestry and Fishing |
273,575 |
199,378 |
242,979 |
254,324 |
284,255 |
348,273 |
405,587 |
16.5% |
| Mining |
0 |
195 |
0 |
3,189 |
2,665 |
0 |
0 |
NA
|
| Construction |
339,169 |
425,666 |
438,319 |
396,176 |
504,628 |
546,496 |
593,110 |
8.5% |
| Manufacturing |
966,116 |
974,329 |
957,392 |
854,252 |
820,347 |
809,992 |
890,323 |
9.9% |
| Transportation,
Communication, Public Utilities |
4,581,948 |
4,873,456 |
4,789,944 |
4,710,712 |
5,098,165 |
6,103,590 |
6,042,968 |
-1.0% |
| Wholesale |
3,558,091 |
3,646,992 |
4,077,191 |
4,230,347 |
4,180,681 |
4,977,060 |
5,555,161 |
11.6% |
| Retail |
22,381,274 |
22,630,880 |
24,087,192 |
25,407,368 |
28,342,339 |
31,756,400 |
33,979,504 |
7.0% |
| Finance,
Insurance, Real Estate |
1,352,591 |
1,412,900 |
1,486,607 |
1,610,227 |
1,774,305 |
1,962,598 |
1,979,845 |
0.9% |
| Services |
9,331,913 |
9,413,230 |
9,997,958 |
10,411,135 |
11,892,824 |
12,883,493 |
13,387,537 |
3.9% |
| Total |
42,784,677 |
43,577,026 |
46,077,582 |
47,877,730 |
52,900,209 |
59,387,902 |
62,834,035 |
5.8% |
| Annual
Change |
|
1.9% |
5.7% |
3.9% |
10.5% |
12.3% |
5.8% |
|
|


