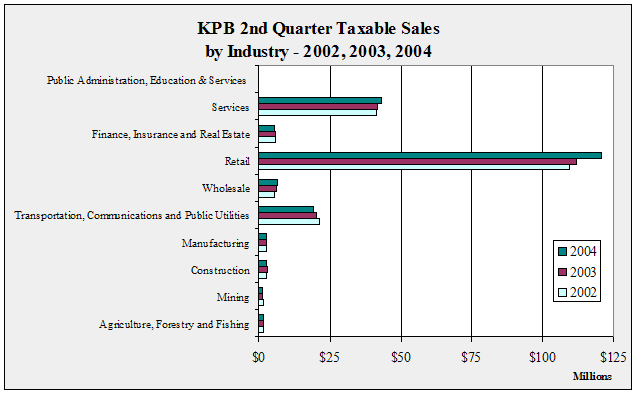
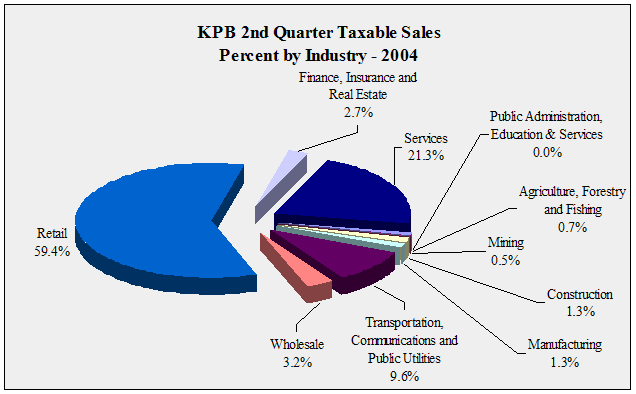
| KPB
2nd Quarter Taxable Sales by Industry - 1998-2004 - in $ |
| |
1998 |
1999 |
2000 |
2001 |
2002 |
2003 |
2004 |
Annual
Change |
| Agriculture,
Forestry and Fishing |
1,093,031 |
1,087,418 |
1,259,115 |
1,401,861 |
1,423,988 |
1,577,278 |
1,416,681 |
-10.2% |
| Mining |
1,333,456 |
936,119 |
1,086,368 |
1,349,445 |
1,484,251 |
1,170,493 |
1,059,508 |
-9.5% |
| Construction |
2,585,144 |
2,452,936 |
2,474,506 |
2,523,634 |
2,677,014 |
3,121,111 |
2,708,812 |
-13.2% |
| Manufacturing |
2,712,143 |
2,644,412 |
2,809,920 |
2,885,132 |
2,791,765 |
2,607,213 |
2,654,083 |
1.8% |
| Transportation,
Communications and Public Utilities |
17,752,689 |
18,580,759 |
19,191,077 |
19,120,564 |
21,523,834 |
20,364,671 |
19,470,893 |
-4.4% |
| Wholesale |
4,600,278 |
4,704,744 |
5,579,186 |
5,820,231 |
5,679,123 |
6,296,538 |
6,547,054 |
4.0% |
| Retail |
93,073,093 |
95,045,828 |
99,404,300 |
108,285,999 |
109,531,195 |
112,007,335 |
120,553,067 |
7.6% |
| Finance,
Insurance and Real Estate |
4,803,380 |
4,899,070 |
5,111,478 |
5,949,185 |
6,077,106 |
5,974,212 |
5,438,300 |
-9.0% |
| Services |
35,290,025 |
37,260,491 |
39,529,668 |
41,063,347 |
41,586,472 |
41,774,239 |
43,153,735 |
3.3% |
| Public
Administration, Education & Services |
6,002 |
6,881 |
5,835 |
5,238 |
7,859 |
8,680 |
8,521 |
-1.8% |
| Total |
163,249,241 |
167,618,658 |
176,451,453 |
188,404,636 |
192,782,607 |
194,901,770 |
203,010,654 |
4.2% |
| Annual |
|
2.7% |
5.3% |
6.8% |
2.3% |
1.1% |
4.2% |
|
|
| KPB
2nd Quarter Taxable Sales Ten Year Change by Industry - 1994-2004 - in
$ |
| |
|
|
10
Year Change |
| |
1994 |
2004 |
Percentage |
Numerical |
| Agriculture,
Forestry and Fishing |
1,205,238 |
1,416,681 |
17.5% |
211,443 |
| Mining |
1,697,476 |
1,059,508 |
-37.6% |
-637,968 |
| Construction |
1,923,287 |
2,708,812 |
40.8% |
785,525 |
| Manufacturing |
2,127,484 |
2,654,083 |
24.8% |
526,599 |
| Transportation,
Communications and Public Utilities |
15,620,966 |
19,470,893 |
24.6% |
3,849,927 |
| Wholesale |
4,949,116 |
6,547,054 |
32.3% |
1,597,938 |
| Retail |
78,872,973 |
120,553,067 |
52.8% |
41,680,094 |
| Finance, Insurance
and Real Estate |
4,687,253 |
5,438,300 |
16.0% |
751,047 |
| Services |
29,999,155 |
43,153,735 |
43.8% |
13,154,580 |
| Public
Administration, Education & Services |
2,059 |
8,521 |
313.8% |
6,462 |
| Total |
141,085,007 |
203,010,654 |
43.9% |
61,925,647 |
|
|
KPB 2nd Quarter Taxable Sales One Year Change
by Industry - 2003-2004 - in $
|
| |
|
|
1
Year Change |
| |
2003 |
2004 |
Percentage |
Numerical |
| Agriculture,
Forestry and Fishing |
1,577,278 |
1,416,681 |
-10.2% |
-160,597 |
| Mining |
1,170,493 |
1,059,508 |
-9.5% |
-110,985 |
| Construction |
3,121,111 |
2,708,812 |
-13.2% |
-412,299 |
| Manufacturing |
2,607,213 |
2,654,083 |
1.8% |
46,870 |
| Transportation,
Communications and Public Utilities |
20,364,671 |
19,470,893 |
-4.4% |
-893,778 |
| Wholesale |
6,296,538 |
6,547,054 |
4.0% |
250,516 |
| Retail |
112,007,335 |
120,553,067 |
7.6% |
8,545,732 |
| Finance,
Insurance and Real Estate |
5,974,212 |
5,438,300 |
-9.0% |
-535,912 |
| Services |
41,774,239 |
43,153,735 |
3.3% |
1,379,496 |
| Public
Administration, Education & Services |
8,680 |
8,521 |
-1.8% |
-159 |
| Total |
194,901,770 |
203,010,654 |
4.2% |
8,108,884 |
|


