|
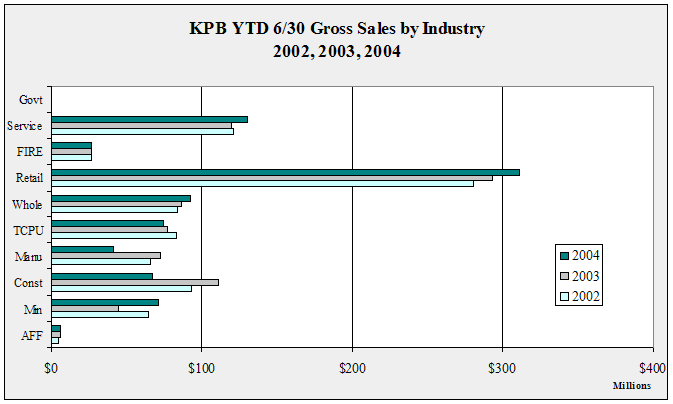
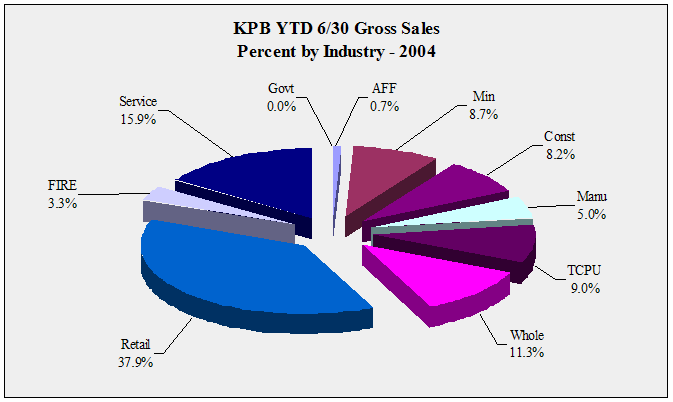
KPB YTD 6/30 Gross Sales by Industry -
1998-2004 - in $
|
| |
1998 |
1999 |
2000 |
2001 |
2002 |
2003 |
2004 |
Annual
Change |
| Agriculture,
Forestry and Fishing |
6,272,582 |
4,232,629 |
7,324,230 |
4,363,498 |
4,861,344 |
6,065,662 |
5,965,639 |
-1.6% |
| Mining |
101,334,937 |
60,073,571 |
46,735,102 |
54,334,306 |
64,523,892 |
44,343,827 |
71,700,486 |
61.7% |
| Construction |
67,212,443 |
62,530,398 |
71,299,355 |
91,138,931 |
92,814,200 |
110,689,250 |
67,468,856 |
-39.0% |
| Manufacturing |
67,129,780 |
64,380,550 |
59,515,301 |
105,149,536 |
66,005,209 |
72,836,195 |
41,048,333 |
-43.6% |
| Transportation,
Communication & Public Utilities |
76,899,411 |
79,777,691 |
73,872,103 |
78,697,492 |
83,204,861 |
77,149,056 |
74,083,738 |
-4.0% |
| Wholesale |
67,894,686 |
69,463,920 |
77,663,421 |
80,099,303 |
83,667,742 |
86,760,176 |
92,390,805 |
6.5% |
| Retail |
252,301,975 |
243,879,541 |
256,300,309 |
282,718,828 |
280,578,396 |
292,982,569 |
311,302,630 |
6.3% |
| Finance,
Insurance & Real Estate |
24,719,028 |
25,048,139 |
24,317,433 |
24,386,145 |
27,144,115 |
26,977,815 |
26,790,075 |
-0.7% |
| Services |
91,345,262 |
94,089,544 |
100,554,897 |
107,072,197 |
121,062,304 |
119,624,276 |
130,430,166 |
9.0% |
| Public
Administration, Education & Services |
12,293 |
19,812 |
13,322 |
11,745 |
14,559 |
20,999 |
22,184 |
5.6% |
| Total |
755,122,397 |
703,495,795 |
717,595,473 |
827,971,981 |
823,876,622 |
837,449,825 |
821,202,912 |
-1.9% |
| Annual
Change |
|
-6.8% |
2.0% |
15.4% |
-0.5% |
1.6% |
-1.9% |
|
|
| KPB
YTD 6/30 Gross Sales Ten Year Change by Industry - 1994-2004 - in $ |
| |
|
|
10
Year Change |
| |
1994 |
2004 |
Percentage |
Numerical |
| Agriculture,
Forestry and Fishing |
21,757,706 |
5,965,639 |
-72.6% |
-15,792,067 |
| Mining |
57,950,184 |
71,700,486 |
23.7% |
13,750,302 |
| Construction |
54,664,751 |
67,468,856 |
23.4% |
12,804,105 |
| Manufacturing |
53,787,259 |
41,048,333 |
-23.7% |
-12,738,926 |
| Transportation,
Communication & Public Utilities |
87,866,582 |
74,083,738 |
-15.7% |
-13,782,844 |
| Wholesale |
35,162,821 |
92,390,805 |
162.8% |
57,227,984 |
| Retail |
180,477,674 |
311,302,630 |
72.5% |
130,824,956 |
| Finance,
Insurance & Real Estate |
29,904,000 |
26,790,075 |
-10.4% |
-3,113,925 |
| Services |
76,998,296 |
130,430,166 |
69.4% |
53,431,870 |
| Public
Administration, Education & Services |
5,766 |
22,184 |
284.7% |
16,418 |
| Total |
598,575,039 |
821,202,912 |
37.2% |
222,627,873 |
|
|
KPB YTD 6/30 Gross Sales One Year Change by
Industry - 2003-2004 - in $
|
| |
|
|
1
Year Change |
| |
2003 |
2004 |
Percentage |
Numerical |
| Agriculture,
Forestry and Fishing |
6,065,662 |
5,965,639 |
-1.6% |
-100,023 |
| Mining |
44,343,827 |
71,700,486 |
61.7% |
27,356,659 |
| Construction |
110,689,250 |
67,468,856 |
-39.0% |
-43,220,394 |
| Manufacturing |
72,836,195 |
41,048,333 |
-43.6% |
-31,787,862 |
| Transportation,
Communication & Public Utilities |
77,149,056 |
74,083,738 |
-4.0% |
-3,065,318 |
| Wholesale |
86,760,176 |
92,390,805 |
6.5% |
5,630,629 |
| Retail |
292,982,569 |
311,302,630 |
6.3% |
18,320,061 |
| Finance,
Insurance & Real Estate |
26,977,815 |
26,790,075 |
-0.7% |
-187,740 |
| Services |
119,624,276 |
130,430,166 |
9.0% |
10,805,890 |
| Public
Administration, Education & Services |
20,999 |
22,184 |
5.6% |
1,185 |
| Total |
837,449,825 |
821,202,912 |
-1.9% |
-16,246,913 |
|


