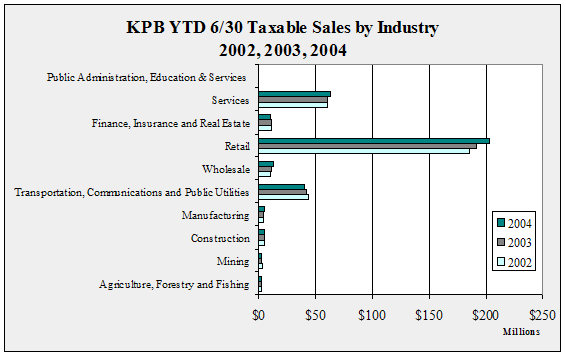
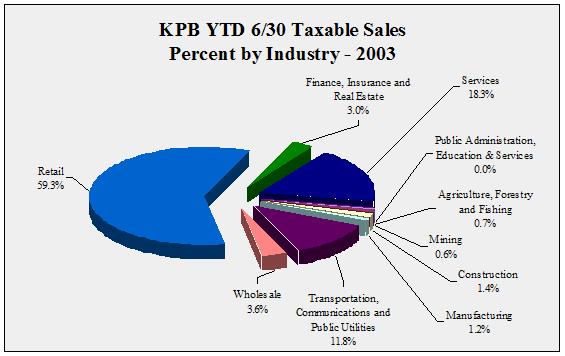
|
KPB YTD 6/30 Taxable Sales by Industry -
1998-2004 - in $
|
| |
1998 |
1999 |
2000 |
2001 |
2002 |
2003 |
2004 |
Annual
Change |
| Agriculture, Forestry and Fishing |
1,628,706 |
1,618,223 |
1,903,084 |
2,129,092 |
2,220,368 |
2,340,323 |
2,303,324 |
-1.6% |
| Mining |
2,992,932 |
1,701,296 |
1,987,867 |
2,577,296 |
2,966,852 |
2,404,111 |
2,110,176 |
-12.2% |
| Construction |
4,188,048 |
4,372,902 |
4,349,679 |
4,388,424 |
4,713,540 |
5,171,807 |
4,913,976 |
-5.0% |
| Manufacturing |
4,258,440 |
4,087,599 |
4,284,876 |
4,382,690 |
4,099,509 |
4,046,100 |
4,161,475 |
2.9% |
| Transportation, Communications and Public Utilities |
35,689,681 |
38,030,469 |
38,419,088 |
38,477,397 |
43,130,031 |
42,040,778 |
40,532,000 |
-3.6% |
| Wholesale |
8,850,273 |
8,746,060 |
10,022,041 |
10,426,376 |
10,462,384 |
11,314,549 |
12,404,238 |
9.6% |
| Retail |
156,080,063 |
160,203,329 |
167,206,480 |
181,793,867 |
185,743,986 |
191,734,970 |
203,340,703 |
6.1% |
| Finance, Insurance and Real Estate |
9,067,825 |
9,293,864 |
9,453,582 |
10,932,159 |
11,529,292 |
11,283,006 |
10,329,880 |
-8.4% |
| Services |
51,335,519 |
53,943,980 |
56,962,041 |
59,110,111 |
60,680,208 |
60,758,278 |
62,575,708 |
3.0% |
| Public Administration, Education & Services |
12,293 |
19,812 |
13,322 |
11,745 |
14,559 |
20,999 |
22,119 |
5.3% |
| Total |
274,103,780 |
282,017,534 |
294,602,060 |
314,229,157 |
325,560,729 |
331,114,921 |
342,693,599 |
3.5% |
| Annual
Change |
|
2.9% |
4.5% |
6.7% |
3.6% |
1.7% |
3.5% |
|
|
|
KPB YTD 6/30 Taxable Sales Ten Year Change by
Industry - 1994-2004 - in $
|
| |
|
|
10
Year Change |
| |
1994 |
2004 |
Percentage |
Numerical |
| Agriculture,
Forestry and Fishing |
1,706,639 |
2,303,324 |
35.0% |
596,685 |
| Mining |
3,245,249 |
2,110,176 |
-35.0% |
-1,135,073 |
| Construction |
3,425,476 |
4,913,976 |
43.5% |
1,488,500 |
| Manufacturing |
3,289,536 |
4,161,475 |
26.5% |
871,939 |
| Transportation,
Communications and Public Utilities |
31,125,941 |
40,532,000 |
30.2% |
9,406,059 |
| Wholesale |
9,156,054 |
12,404,238 |
35.5% |
3,248,184 |
| Retail |
131,190,709 |
203,340,703 |
55.0% |
72,149,994 |
| Finance,
Insurance and Real Estate |
8,883,546 |
10,329,880 |
16.3% |
1,446,334 |
| Services |
44,062,764 |
62,575,708 |
42.0% |
18,512,944 |
| Public
Administration, Education & Services |
5,766 |
22,119 |
283.6% |
16,353 |
| Total |
236,091,680 |
342,693,599 |
45.2% |
106,601,919 |
|
|
KPB YTD 6/30 Taxable Sales One Year Change by
Industry - 2003-2004 - in $
|
| |
|
|
1
Year Change |
| |
2003 |
2004 |
Percentage |
Numerical |
| Agriculture,
Forestry and Fishing |
2,340,323 |
2,303,324 |
-1.6% |
-36,999 |
| Mining |
2,404,111 |
2,110,176 |
-12.2% |
-293,935 |
| Construction |
5,171,807 |
4,913,976 |
-5.0% |
-257,831 |
| Manufacturing |
4,046,100 |
4,161,475 |
2.9% |
115,375 |
| Transportation,
Communications and Public Utilities |
42,040,778 |
40,532,000 |
-3.6% |
-1,508,778 |
| Wholesale |
11,314,549 |
12,404,238 |
9.6% |
1,089,689 |
| Retail |
191,734,970 |
203,340,703 |
6.1% |
11,605,733 |
| Finance,
Insurance and Real Estate |
11,283,006 |
10,329,880 |
-8.4% |
-953,126 |
| Services |
60,758,278 |
62,575,708 |
3.0% |
1,817,430 |
| Public
Administration, Education & Services |
20,999 |
22,119 |
5.3% |
1,120 |
| Total |
331,114,921 |
342,693,599 |
3.5% |
11,578,678 |
|


