|
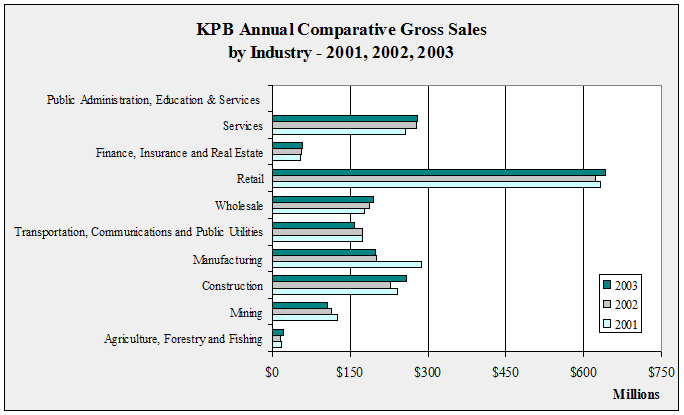
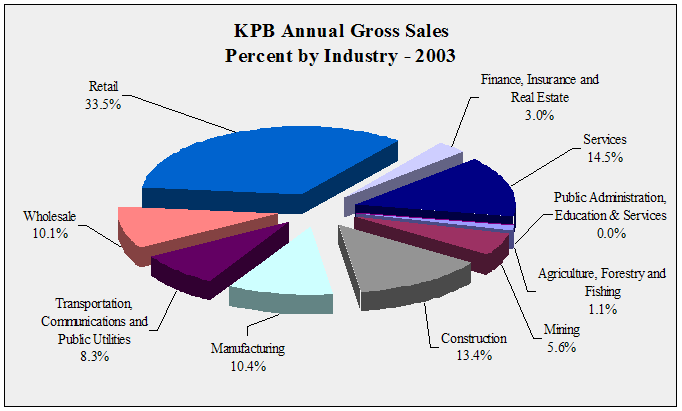
KPB Annual Gross Sales by Industry - 1997-2003
- in $
|
| |
1997 |
1998 |
1999 |
2000 |
2001 |
2002 |
2003 |
Annual
Change |
| Agriculture,
Forestry and Fishing |
49,840,002 |
30,373,442 |
32,347,943 |
24,816,872 |
17,562,823 |
16,750,059 |
22,009,310 |
31.4% |
| Mining |
135,624,731 |
190,689,442 |
115,241,075 |
121,868,065 |
126,250,792 |
113,521,181 |
106,561,739 |
-6.1% |
| Construction |
185,590,382 |
187,102,648 |
166,008,223 |
185,818,062 |
241,487,935 |
228,513,471 |
257,305,116 |
12.6% |
| Manufacturing |
169,016,381 |
147,360,433 |
165,066,528 |
117,856,947 |
287,725,053 |
201,047,383 |
199,437,364 |
-0.8% |
| Transportation,
Communications and Public Utilities |
148,097,013 |
159,766,641 |
169,321,042 |
156,527,508 |
173,593,812 |
172,805,525 |
158,642,931 |
-8.2% |
| Wholesale |
151,043,115 |
149,117,372 |
155,121,630 |
171,235,874 |
177,037,109 |
188,223,387 |
194,212,922 |
3.2% |
| Retail |
504,943,192 |
547,202,550 |
545,752,691 |
579,332,085 |
632,371,962 |
623,558,166 |
642,801,465 |
3.1% |
| Finance,
Insurance and Real Estate |
52,727,075 |
50,782,517 |
51,186,806 |
50,374,753 |
54,073,741 |
54,921,193 |
57,998,647 |
5.6% |
| Services |
196,620,112 |
211,144,805 |
220,251,298 |
236,647,645 |
256,467,494 |
277,141,783 |
278,893,331 |
0.6% |
| Public
Administration, Education & Services |
45,245 |
26,751 |
28,814 |
17,350 |
20,316 |
22,579 |
41,980 |
85.9% |
| Total |
1,593,547,248 |
1,673,566,601 |
1,620,326,050 |
1,644,495,161 |
1,966,591,037 |
1,876,504,727 |
1,917,904,805 |
2.2% |
| Annual |
|
5.0% |
-3.2% |
1.5% |
19.6% |
-4.6% |
2.2% |
|
|
|
KPB Annual Gross Sales Ten Year Change by
Industry - 1993-2003 - in $
|
| |
|
|
10
Year Change |
| |
1993 |
2003 |
Percentage |
Numerical |
| Agriculture,
Forestry and Fishing |
68,690,735 |
22,009,310 |
-68.0% |
-46,681,425 |
| Mining |
122,926,355 |
106,561,739 |
-13.3% |
-16,364,616 |
| Construction |
126,432,113 |
257,305,116 |
103.5% |
130,873,003 |
| Manufacturing |
119,602,870 |
199,437,364 |
66.7% |
79,834,494 |
| Transportation,
Communications and Public Utilities |
215,875,618 |
158,642,931 |
-26.5% |
-57,232,687 |
| Wholesale |
65,326,820 |
194,212,922 |
197.3% |
128,886,102 |
| Retail |
375,876,957 |
642,801,465 |
71.0% |
266,924,508 |
| Finance,
Insurance and Real Estate |
47,089,458 |
57,998,647 |
23.2% |
10,909,189 |
| Services |
149,140,054 |
278,893,331 |
87.0% |
129,753,277 |
| Public
Administration, Education & Services |
8,126 |
41,980 |
416.6% |
33,854 |
| Total |
1,290,969,106 |
1,917,904,805 |
48.6% |
626,935,699 |
|
|
KPB Annual Gross Sales One Year Change by
Industry - 2002-2003 - in $
|
| |
|
|
1
Year Change |
| |
2002 |
2003 |
Percentage |
Numerical |
| Agriculture,
Forestry and Fishing |
16,750,059 |
22,009,310 |
31.4% |
5,259,251 |
| Mining |
113,521,181 |
106,561,739 |
-6.1% |
-6,959,442 |
| Construction |
228,513,471 |
257,305,116 |
12.6% |
28,791,645 |
| Manufacturing |
201,047,383 |
199,437,364 |
-0.8% |
-1,610,019 |
| Transportation,
Communications and Public Utilities |
172,805,525 |
158,642,931 |
-8.2% |
-14,162,594 |
| Wholesale |
188,223,387 |
194,212,922 |
3.2% |
5,989,535 |
| Retail |
623,558,166 |
642,801,465 |
3.1% |
19,243,299 |
| Finance,
Insurance and Real Estate |
54,921,193 |
57,998,647 |
5.6% |
3,077,454 |
| Services |
277,141,783 |
278,893,331 |
0.6% |
1,751,548 |
| Public
Administration, Education & Services |
22,579 |
41,980 |
85.9% |
19,401 |
| Total |
1,876,504,727 |
1,917,904,805 |
2.2% |
41,400,078 |
|


