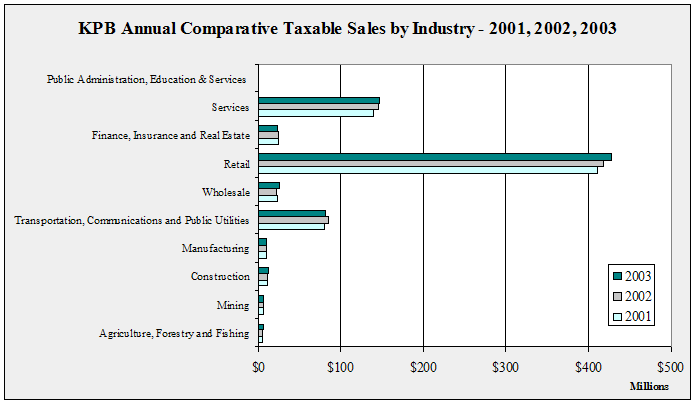
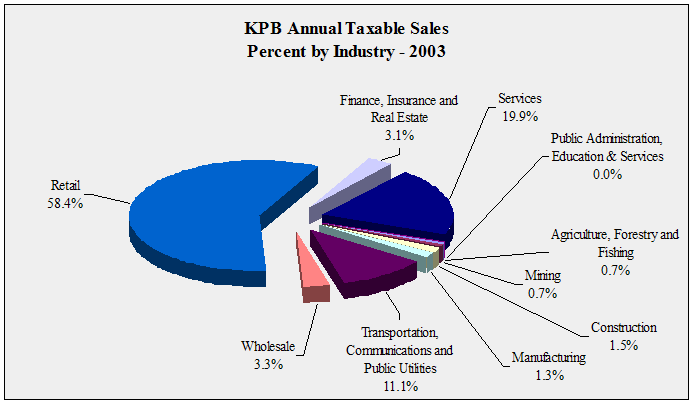
| KPB
Annual Taxable Sales by Industry - 1997-2003 - in $ |
| |
1997 |
1998 |
1999 |
2000 |
2001 |
2002 |
2003 |
Annual
Change |
| Agriculture,
Forestry and Fishing |
3,354,906 |
3,458,989 |
3,539,802 |
4,148,862 |
4,390,790 |
4,461,252 |
5,010,961 |
12.3% |
| Mining |
5,109,284 |
5,202,698 |
3,828,650 |
4,613,878 |
5,863,223 |
5,848,904 |
4,885,262 |
-16.5% |
| Construction |
8,746,301 |
9,821,330 |
9,921,434 |
9,648,292 |
9,995,849 |
10,703,632 |
11,261,356 |
5.2% |
| Manufacturing |
9,258,454 |
9,578,020 |
9,251,298 |
9,792,611 |
9,654,663 |
9,616,559 |
9,235,045 |
-4.0% |
| Transportation,
Communications & Public Utilities |
69,494,931 |
72,108,745 |
79,282,344 |
77,620,518 |
79,669,176 |
84,140,679 |
81,583,395 |
-3.0% |
| Wholesale |
20,313,425 |
18,357,305 |
19,290,256 |
21,493,691 |
22,308,044 |
21,690,782 |
24,139,455 |
11.3% |
| Retail |
339,027,380 |
353,131,302 |
367,123,730 |
382,738,961 |
410,495,194 |
418,295,651 |
427,771,497 |
2.3% |
| Finance,
Insurance and Real Estate |
18,489,067 |
18,576,711 |
18,862,816 |
20,689,601 |
23,466,772 |
24,081,227 |
22,742,851 |
-5.6% |
| Services |
116,685,824 |
122,225,757 |
129,434,976 |
136,236,408 |
139,391,133 |
145,002,613 |
145,308,439 |
0.2% |
| Public
Administration, Education & Services |
45,238 |
26,744 |
28,814 |
17,350 |
20,316 |
22,579 |
41,980 |
85.9% |
| Total |
590,524,810 |
612,487,601 |
640,564,120 |
667,000,172 |
705,255,160 |
723,863,878 |
731,980,241 |
1.1% |
| Annual |
|
3.7% |
4.6% |
4.1% |
5.7% |
2.6% |
1.1% |
|
|
|
KPB Annual Taxable Sales Ten Year Change by
Industry - 1993-2003 - in $
|
| |
|
|
10
Year Change |
| |
1993 |
2003 |
Percentage |
Numerical |
| Agriculture,
Forestry and Fishing |
3,565,282 |
5,010,961 |
40.5% |
1,445,679 |
| Mining |
7,547,231 |
4,885,262 |
-35.3% |
-2,661,969 |
| Construction |
7,579,704 |
11,261,356 |
48.6% |
3,681,652 |
| Manufacturing |
7,125,238 |
9,235,045 |
29.6% |
2,109,807 |
| Transportation,
Communications and Public Utilities |
59,191,931 |
81,583,395 |
37.8% |
22,391,464 |
| Wholesale |
17,462,571 |
24,139,455 |
38.2% |
6,676,884 |
| Retail |
281,028,087 |
427,771,497 |
52.2% |
146,743,410 |
| Finance,
Insurance and Real Estate |
17,516,227 |
22,742,851 |
29.8% |
5,226,624 |
| Services |
91,261,264 |
145,308,439 |
59.2% |
54,047,175 |
| Public
Administration, Education & Services |
7,670 |
41,980 |
447.3% |
34,310 |
| Total |
492,285,205 |
731,980,241 |
48.7% |
239,695,036 |
|
|
KPB Annual Taxable Sales One Year Change by
Industry - 2002-2003 - in $
|
| |
|
|
1
Year Change |
| |
2002 |
2003 |
Percentage |
Numerical |
| Agriculture,
Forestry and Fishing |
4,461,252 |
5,010,961 |
12.3% |
549,709 |
| Mining |
5,848,904 |
4,885,262 |
-16.5% |
-963,642 |
| Construction |
10,703,632 |
11,261,356 |
5.2% |
557,724 |
| Manufacturing |
9,616,559 |
9,235,045 |
-4.0% |
-381,514 |
| Transportation,
Communications and Public Utilities |
84,140,679 |
81,583,395 |
-3.0% |
-2,557,284 |
| Wholesale |
21,690,782 |
24,139,455 |
11.3% |
2,448,673 |
| Retail |
418,295,651 |
427,771,497 |
2.3% |
9,475,846 |
| Finance,
Insurance and Real Estate |
24,081,227 |
22,742,851 |
-5.6% |
-1,338,376 |
| Services |
145,002,613 |
145,308,439 |
0.2% |
305,826 |
| Public
Administration, Education & Services |
22,579 |
41,980 |
85.9% |
19,401 |
| Total |
723,863,878 |
731,980,241 |
1.1% |
8,116,363 |
|


