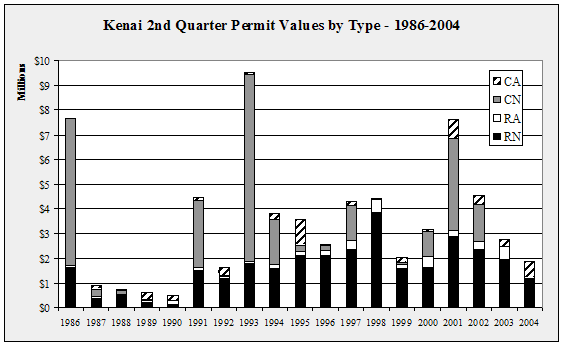
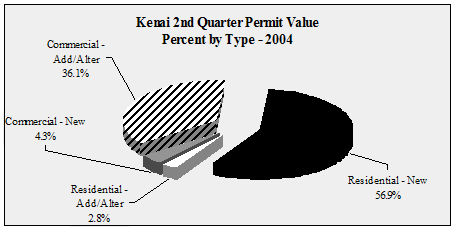
| Kenai 2nd Quarter Permit Values
by Type - 1998-2004 - in $ |
| |
1998 |
1999 |
2000 |
2001 |
2002 |
2003 |
2004 |
Annual
Change |
| Residential
- New |
3,884,500 |
1,573,000 |
1,606,000 |
2,886,000 |
2,362,000 |
1,943,000 |
1,079,000 |
-44.5% |
| Residential
- Add/Alter |
495,500 |
187,600 |
439,000 |
228,300 |
323,100 |
515,200 |
52,200 |
-89.9% |
| Commercial
- New |
0 |
61,000 |
1,045,000 |
3,744,000 |
1,480,000 |
0 |
81,000 |
NA
|
| Commercial
- Add/Alter |
21,500 |
201,000 |
73,000 |
739,600 |
404,300 |
270,150 |
685,200 |
153.6% |
| TOTAL |
4,401,500 |
2,022,600 |
3,163,000 |
7,597,900 |
4,569,400 |
2,728,350 |
1,897,400 |
-30.5% |
| Annual
Change |
|
-54.0% |
56.4% |
140.2% |
-39.9% |
-40.3% |
-30.5% |
|
|


