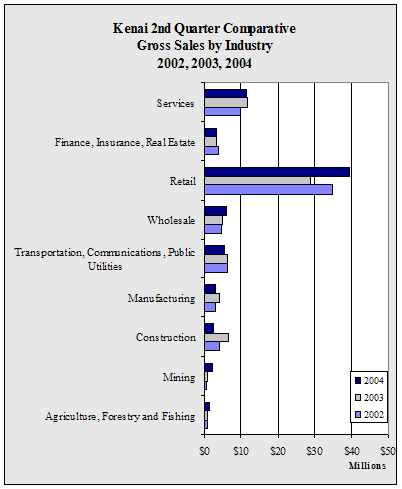
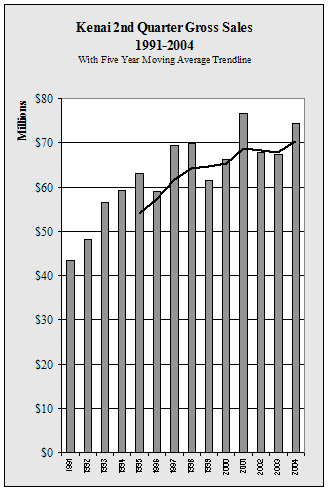
| Kenai
2nd Quarter Gross Sales by Industry - 1998-2004 - in $ |
| |
1998 |
1999 |
2000 |
2001 |
2002 |
2003 |
2004 |
Annual
Change |
| Agriculture,
Forestry and Fishing |
1,964,499 |
1,270,536 |
3,141,165 |
787,584 |
810,865 |
838,734 |
1,296,885 |
54.6% |
| Mining |
28,370 |
64,414 |
1,309,839 |
321,650 |
516,408 |
872,788 |
2,172,358 |
148.9% |
| Construction |
5,574,058 |
3,454,181 |
2,522,636 |
5,290,031 |
4,219,747 |
6,445,840 |
2,508,425 |
-61.1% |
| Manufacturing |
2,047,152 |
1,946,098 |
2,490,501 |
3,567,493 |
3,007,187 |
4,210,293 |
2,931,945 |
-30.4% |
| Transportation,
Communications, Public Utilities |
6,034,502 |
6,040,727 |
5,934,855 |
5,910,673 |
6,211,821 |
6,206,828 |
5,550,636 |
-10.6% |
| Wholesale |
2,826,075 |
2,623,775 |
4,370,523 |
5,269,381 |
4,677,095 |
4,841,740 |
5,963,008 |
23.2% |
| Retail |
40,187,897 |
35,052,059 |
35,185,697 |
42,833,698 |
34,722,471 |
28,907,855 |
39,327,880 |
36.0% |
| Finance,
Insurance, Real Estate |
2,658,319 |
2,725,582 |
2,912,589 |
3,513,695 |
3,667,615 |
3,256,374 |
3,161,096 |
-2.9% |
| Services |
8,475,029 |
8,427,674 |
8,290,702 |
9,199,742 |
9,997,010 |
11,786,203 |
11,608,393 |
-1.5% |
| Total |
69,795,901 |
61,605,046 |
66,158,507 |
76,693,947 |
67,830,219 |
67,366,655 |
74,520,626 |
10.6% |
| Annual
Change |
|
-11.7% |
7.4% |
15.9% |
-11.6% |
-0.7% |
10.6% |
|
|


