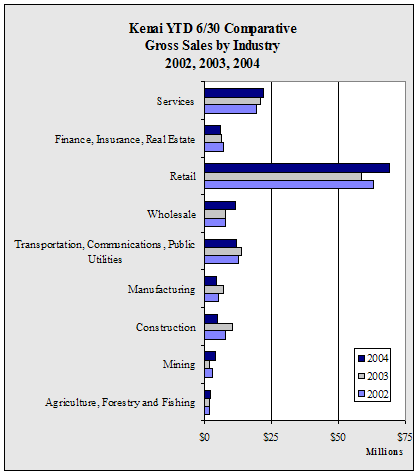
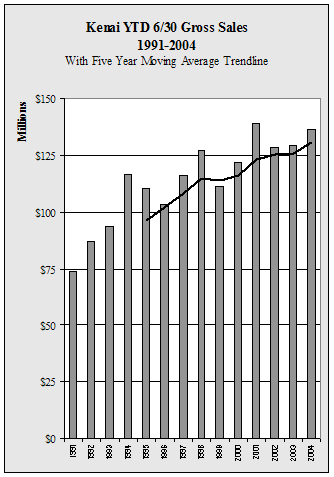
| Kenai
YTD 6/30 Gross Sales by Industry - 1998-2004 - in $ |
| |
1998 |
1999 |
2000 |
2001 |
2002 |
2003 |
2004 |
Annual
Change |
| Agriculture,
Forestry and Fishing |
3,003,278 |
1,899,646 |
4,431,098 |
1,420,941 |
1,981,179 |
1,841,384 |
2,358,671 |
28.1% |
| Mining |
50,779 |
101,890 |
2,847,277 |
1,174,244 |
2,731,125 |
1,815,358 |
4,184,091 |
130.5% |
| Construction |
8,294,148 |
6,510,071 |
6,201,177 |
7,204,235 |
7,964,387 |
10,554,411 |
4,722,101 |
-55.3% |
| Manufacturing |
3,573,411 |
3,421,280 |
4,759,225 |
6,376,411 |
5,263,340 |
7,207,299 |
4,541,967 |
-37.0% |
| Transportation,
Communications, Public Utilities |
11,733,917 |
12,405,440 |
12,280,605 |
12,042,249 |
12,674,881 |
13,956,594 |
12,081,057 |
-13.4% |
| Wholesale |
4,608,200 |
4,536,478 |
7,093,957 |
10,257,327 |
8,041,983 |
8,063,479 |
11,410,268 |
41.5% |
| Retail |
74,001,436 |
62,113,136 |
63,131,221 |
76,983,734 |
63,196,616 |
58,981,912 |
69,089,995 |
17.1% |
| Finance,
Insurance, Real Estate |
4,995,772 |
5,375,829 |
5,431,409 |
6,476,043 |
7,106,770 |
6,306,976 |
6,025,769 |
-4.5% |
| Services |
16,933,123 |
14,551,068 |
15,591,914 |
17,170,557 |
19,428,380 |
20,733,111 |
22,002,905 |
6.1% |
| Total |
127,194,064 |
110,914,838 |
121,767,883 |
139,105,741 |
128,388,661 |
129,460,524 |
136,416,824 |
5.4% |
| Annual
Change |
|
-12.8% |
9.8% |
14.2% |
-7.7% |
0.8% |
5.4% |
|
|


