| Kenai
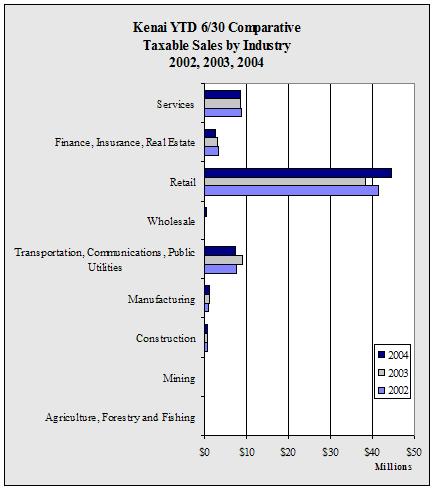
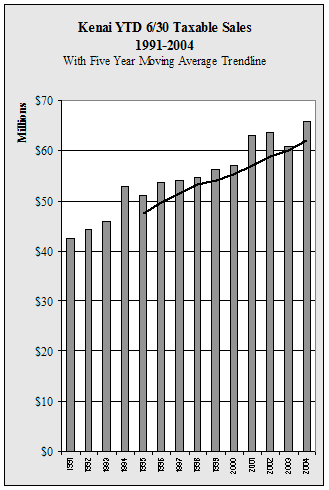
YTD 6/30 Taxable Sales by Industry - 1998-2004 - in $ |
| |
1998 |
1999 |
2000 |
2001 |
2002 |
2003 |
2004 |
Annual
Change |
| Agriculture,
Forestry and Fishing |
192,227 |
204,569 |
206,713 |
201,331 |
219,165 |
222,677 |
256,638 |
15.3% |
| Mining |
33,234 |
13,948 |
63,085 |
131,380 |
108,849 |
80,842 |
121,402 |
50.2% |
| Construction |
534,646 |
534,081 |
493,393 |
504,869 |
521,474 |
537,162 |
552,234 |
2.8% |
| Manufacturing |
981,668 |
932,180 |
1,114,301 |
1,122,782 |
972,235 |
1,128,627 |
1,292,862 |
14.6% |
| Transportation,
Communications, Public Utilities |
6,516,204 |
6,807,788 |
7,170,713 |
6,662,220 |
7,653,616 |
9,057,347 |
7,485,456 |
-17.4% |
| Wholesale |
432,827 |
374,813 |
428,496 |
412,271 |
254,776 |
242,057 |
330,119 |
36.4% |
| Retail |
35,823,447 |
36,566,887 |
36,902,514 |
41,855,555 |
41,562,063 |
38,308,854 |
44,566,694 |
16.3% |
| Finance,
Insurance, Real Estate |
2,450,583 |
2,468,971 |
2,549,746 |
3,197,712 |
3,329,627 |
2,975,487 |
2,559,486 |
-14.0% |
| Services |
7,748,024 |
8,185,622 |
8,140,201 |
8,803,834 |
8,955,827 |
8,378,534 |
8,635,623 |
3.1% |
| Total |
54,712,860 |
56,088,859 |
57,069,162 |
62,891,954 |
63,577,632 |
60,931,587 |
65,800,514 |
8.0% |
| Annual
Change |
|
2.5% |
1.7% |
10.2% |
1.1% |
-4.2% |
8.0% |
|
|


